Data Lake is the firm's big data platform. It consists of a proprietary data store, services, and infrastructure components that are used to house and process petabytes of data every day. As of today, the Data Lake contains a 650+ node HDFS cluster with 200 TB memory, 30K+ cores, and more than a hundred thousand datasets. Data flowing in and out of the Data Lake is crucial for enabling four key business segments of the firm - Global Markets, Consumer and Wealth Management, Asset Management, and Investment Banking. Data Lake has two types of users - Producers and Consumers. Producers produce data which is ingested into Data Lake - each batch of data is merged into an existing snapshot of data for that data store. Consumers can subscribe to multiple data stores and can get the required data exported to multiple database technologies including cloud (also called, virtual warehouses).

The Challenge
The Data Lake platform scales to run hundreds of thousands of ingestions and more than a million exports per day (and we are constantly growing!). Fast processing times for this scale is a financial need - speed is everything! Each of these ingestions and exports is time-sensitive, and the workloads they process vary tremendously in volume. For instance, the same producer can send anywhere from zero to millions of rows depending on the number of trades executed in that hour. The most difficult question to answer operationally has been: which particular ingestion or export has delayed, and also has the potential to delay downstream consumer deadlines? If we could proactively monitor for these, then we can manually intervene and prevent operational misses. This question led us to start estimating the time taken for each ingestion and export using a machine learning model, and subsequently creating an anomaly detection model based on predictions to find outliers.
Modeling Approaches
We started with the simplest possible model - a static threshold (e.g. 2 hours) based on 90th percentile duration of all jobs. This means that if an ingestion takes longer to complete than the static threshold, it is marked as delayed. This approach was proven to be ineffective because batches with larger volumes of data (asymmetric workloads) always took longer than that static threshold.
We then considered training simple statistical models to adjust the static threshold for each dataset based on previous run times for that particular dataset. However, previous runs for a dataset could all be running with a particular feature set, such as ten rows sent every day in a batch. These models fail when a new batch in that dataset changes the parameters, such as sending millions of rows instead of ten rows. If something like this happens, it means that previous runs of that dataset cannot be relied upon (asymmetric workloads issue).
We then moved on to identifying the feature set (~20+ features) that affects these processing times in close collaboration with the Data Lake Developers. Some of the more important features identified are:
- Total rows in batch.
- Number of datasets sent in that batch.
- Merge size (size of the existing snapshot).
- Number of inserts/updates/deletes.
- Number of partitions.
- Parallelism set for big data job.
- Compression ratio of the dataset.
- Schema of the dataset.
- Time of day that a batch request is made.
Interestingly, we realized that there are daily windows when the resources/infrastructure components of Data Lake are processing big workloads, leading to higher wait times for the ingest/export jobs.
Predicting Ingestion Times using Machine Learning
We then explored supervised machine learning techniques (trained on millions of historical ingestion samples with ~20+ features) to predict the ingestion time, as the Baseline Model that we tried before didn't work very well. We experimented with:
- A Decision Tree Regressor for each store.
- One big Decision Tree Regressor for all ingestions (and another one for exports).
Comparing between the Baseline Model and the Decision Tree Regressor for each store, the Decision Tree Regressor had better MSE for 80% of the stores; performance was similar for the rest.
We found that the advantage of training Decision Tree Regressor models for every store (hundreds of thousands of models) is that they capture the micro trends of varying features in a store really well. However, a challenge for training these models was that the number of training samples varied vastly since every store sends batches with different frequencies. We encountered data sparsity issues for low frequency stores which send only 20-30 batches in a year; predictions made were not relevant since the underlying code and infrastructure changes over time as the Lake grows.
We then tried using one big Decision Tree Regressor trained on millions of ingestions (excluding failures) across all stores. It showed 8% lesser MSE than a Decision Tree Regressor for each store. However, this model produced an overall 0.92 R2 score on a test set (using an 80/20 train-test split) which was pretty accurate. We also found other advantages with this model:
- It captures the global trends/buckets of features across the plant, (Data Lake infrastructure/services as a whole is/are referred to as the "plant") and faced no data sparsity issues.
- Better collaboration with developers because of easy interpretability.
- Easy to maintain versions of one model over time in comparison to hundreds of thousands of models.
Example Predictions on One Store
Notice the difference in predictions for the three models as staging row count (number of rows sent in that batch) changes.

We explored other machine learning techniques as well like regression, gradient boosting decision trees, and neural networks which either gave lesser or similar accuracy, but at the cost of interpretability. Easy visualization of the buckets(/splits) based on features are very useful for understanding the features that drive the processing times. We decided to choose big Decision Tree Regressor as the final model for our use-case.
Visualization: Part of the Data Lake Ingestion Tree
Below is a snippet of the big Decision Tree Regressor on ingestions. As can be seen from the first split in the tree, any batch with total rows less than 8 mil, gets ingested in 0.58 minutes on average and otherwise, gets ingested in 5.47 minutes on average.
- std is standard deviation.
- samples is the number of samples in that node.
- value is ingestion duration in minutes.
- Note: Read the tree from left to right.

Lake Happiness
We define the happiness of the Data Lake by how well we perform in real-time against expectations set up by the model for every batch. The Data Lake is considered "happy" if we are able to process all incoming batches in the duration predicted by the model. Theoretically, we are creating an Anomaly Detection Model (explained later) based on the Decision Tree Regressor Model predictions/expectations.
We use these model(s) for:
- Real-time monitoring of expected performance vs reality across plant and across individual users through happiness metrics. This gives users an idea of expected performance and allows us to identify operational/systemic issues in Data Lake.
- Production alerting for batches running longer than expected.
- Prioritizing platform improvements with Data Lake Developers for specific clients who experience lags with their data.
Anomaly Detection (AD) Model
- Model Threshold = Decision Tree Regressor Prediction + max(2* leaf std, hard_buffer) where left std is the standard deviation at the leaf node of decision tree
- Breach minutes = Actual Batch Run time – Model Threshold, if Breach Min > 0 else 0
- Severity (SLI) = Breach minutes/Model Threshold
We used two times the standard deviation at the leaf of the Decision Tree Regressor Node to calculate model threshold. This is done to contain the volume of breaches generated - application of Chebyshev’s inequality. We kept a hard_buffer of 5 minutes in the AD model, because we do not want to alert if there is a deviation of norm by a very few minutes.
A Happy Lake Client
A Data Lake client is happy if their batch gets finished within the threshold predicted by the AD model. Since the model takes into account all the big data features and asymmetric workloads sent by the client (millions of rows or tens of rows and other feature sets), we believe it is reasonable to set client expectations based on it.
Happiness Metric:
- SLI = 0, client is happy, breach min is 0
- SLI = (0,1), client is annoyed, breach min is (0, model_threshold]
- SLI >= 1, client is angry, breach min is (model_threshold, infinity]; meaning that the actual run time is at least twice of the threshold.
We measure the percentage of clients who are happy/unhappy in real-time. Any dip in the happiness graph below indicates that some clients are affected by Data Lake lags. A major dip indicates a systemic issue in Data Lake which would generate internal alerts for the team. We also have different levels of views like plant (overall) view and warehouse view. Using these views, we can easily drill down into clients and batches affected in real-time with the help of the prediction made for those batches and respective breach minutes. We also have a developer focus view for suggesting long term improvements for Data Lake Developers through a list of stores showing high breach minutes.
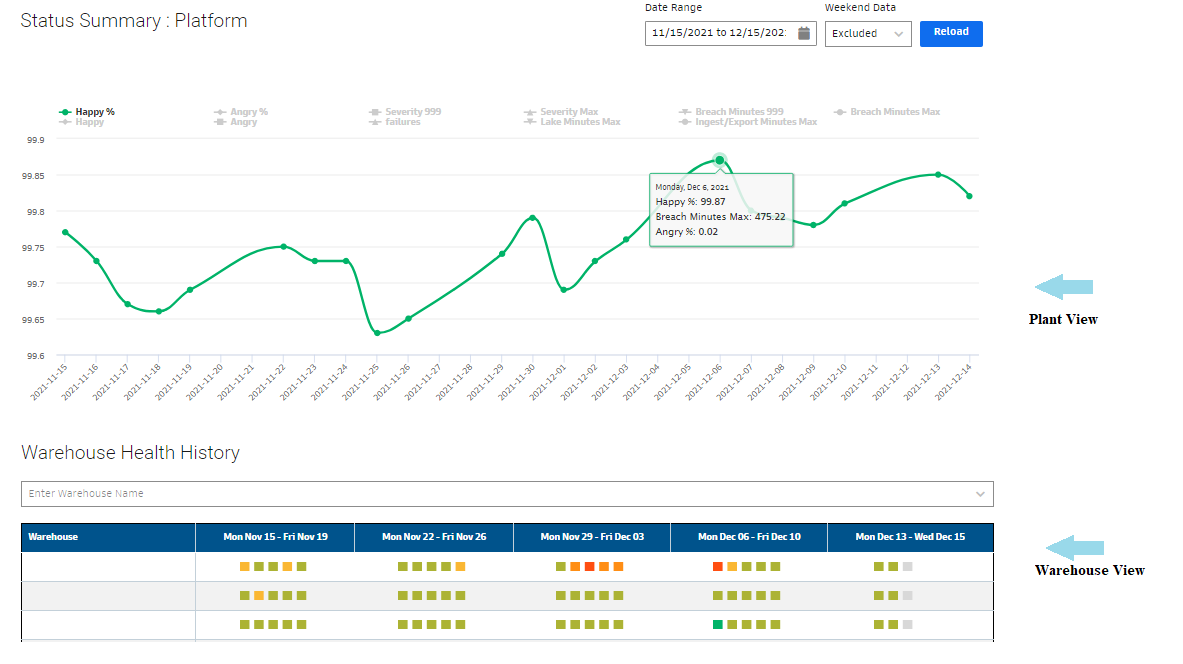
*Warehouse View colored in green to red by the severity (SLI) of any particular breach in ingestion for that warehouse.
Overall, these models have proven to be extremely useful. They continue to generate accurate alerts and prevent delays. We run with >99% happiness on most days for both ingestions and exports!
Learnings
- Partner with domain experts early on, and extract as many "features" as possible from their contextual experience. Our R2 score improved from 0.7 to >0.9 as new features were discovered and added after brainstorming with developers.
- Model Simplicity is directly related to Stakeholder and Client trust. Focusing on accuracy is important but not enough, sometimes in operational settings, where many of the stakeholders might not be engineers. For us, the project's success really depended on whether the model is adopted and understood by all stakeholders or not and thus, directly related to simplicity of the Machine Learning technique used.
- Model Result Explanation is an operational expense. For Machine Learning Engineers, it can become a full day's work to explain why a certain prediction was made by the model. We ended up spending time creating simple visualizations which helped greatly.
- The model is only as good as the time window it is trained on. Major dev releases do necessitate model re-training and putting a new model version in production. However, on the flip side, the effect of any new release on clients can be measured by comparing performance against the existing model. Comparing the prediction results of the new model with the old model is also valuable for identifying specific store behaviors that have changed. However, the more complex question to solve has been how to compare two model versions and identify differences in splits and thresholds. Solving this would potentially make the effects of any new release on clients quite transparent to developers by showcasing which features/branches of the tree diverged in their behavior.
- Predictions from machine learning models can often be challenging to understand and even more complex to explain. For us, tree-based models worked nicely because they are relatively transparent in their splits and buckets, and highly accurate for us. We also created custom visualizations of the trees to understand and explain even better. There is a bit of a trade-off present between interpretability of machine learning models vs accuracy achieved in general. An important focus for us was to find the balance where usefulness of these models exceeded any overhead.
We are happy to see these models improving our operational efficiency and user happiness and continue to be excited about applying machine learning in the Big Data space.
Lake Opportunities
Do you enjoy solving interesting data engineering challenges? Our team is growing and we have several exciting opportunities!
See https://www.gs.com/disclaimer/global_email for important risk disclosures, conflicts of interest, and other terms and conditions relating to this blog and your reliance on information contained in it.
Solutions
Curated Data Security MasterData AnalyticsPlotTool ProPortfolio AnalyticsGS QuantTransaction BankingGS DAP®Liquidity Investing¹ Real-time data can be impacted by planned system maintenance, connectivity or availability issues stemming from related third-party service providers, or other intermittent or unplanned technology issues.
Transaction Banking services are offered by Goldman Sachs Bank USA ("GS Bank") and its affiliates. GS Bank is a New York State chartered bank, a member of the Federal Reserve System and a Member FDIC. For additional information, please see Bank Regulatory Information.
² Source: Goldman Sachs Asset Management, as of March 31, 2025.
Mosaic is a service mark of Goldman Sachs & Co. LLC. This service is made available in the United States by Goldman Sachs & Co. LLC and outside of the United States by Goldman Sachs International, or its local affiliates in accordance with applicable law and regulations. Goldman Sachs International and Goldman Sachs & Co. LLC are the distributors of the Goldman Sachs Funds. Depending upon the jurisdiction in which you are located, transactions in non-Goldman Sachs money market funds are affected by either Goldman Sachs & Co. LLC, a member of FINRA, SIPC and NYSE, or Goldman Sachs International. For additional information contact your Goldman Sachs representative. Goldman Sachs & Co. LLC, Goldman Sachs International, Goldman Sachs Liquidity Solutions, Goldman Sachs Asset Management, L.P., and the Goldman Sachs funds available through Goldman Sachs Liquidity Solutions and other affiliated entities, are under the common control of the Goldman Sachs Group, Inc.
Goldman Sachs & Co. LLC is a registered U.S. broker-dealer and futures commission merchant, and is subject to regulatory capital requirements including those imposed by the SEC, the U.S. Commodity Futures Trading Commission (CFTC), the Chicago Mercantile Exchange, the Financial Industry Regulatory Authority, Inc. and the National Futures Association.
FOR INSTITUTIONAL USE ONLY - NOT FOR USE AND/OR DISTRIBUTION TO RETAIL AND THE GENERAL PUBLIC.
This material is for informational purposes only. It is not an offer or solicitation to buy or sell any securities.
THIS MATERIAL DOES NOT CONSTITUTE AN OFFER OR SOLICITATION IN ANY JURISDICTION WHERE OR TO ANY PERSON TO WHOM IT WOULD BE UNAUTHORIZED OR UNLAWFUL TO DO SO. Prospective investors should inform themselves as to any applicable legal requirements and taxation and exchange control regulations in the countries of their citizenship, residence or domicile which might be relevant. This material is provided for informational purposes only and should not be construed as investment advice or an offer or solicitation to buy or sell securities. This material is not intended to be used as a general guide to investing, or as a source of any specific investment recommendations, and makes no implied or express recommendations concerning the manner in which any client's account should or would be handled, as appropriate investment strategies depend upon the client's investment objectives.
United Kingdom: In the United Kingdom, this material is a financial promotion and has been approved by Goldman Sachs Asset Management International, which is authorized and regulated in the United Kingdom by the Financial Conduct Authority.
European Economic Area (EEA): This marketing communication is disseminated by Goldman Sachs Asset Management B.V., including through its branches ("GSAM BV"). GSAM BV is authorised and regulated by the Dutch Authority for the Financial Markets (Autoriteit Financiële Markten, Vijzelgracht 50, 1017 HS Amsterdam, The Netherlands) as an alternative investment fund manager ("AIFM") as well as a manager of undertakings for collective investment in transferable securities ("UCITS"). Under its licence as an AIFM, the Manager is authorized to provide the investment services of (i) reception and transmission of orders in financial instruments; (ii) portfolio management; and (iii) investment advice. Under its licence as a manager of UCITS, the Manager is authorized to provide the investment services of (i) portfolio management; and (ii) investment advice.
Information about investor rights and collective redress mechanisms are available on www.gsam.com/responsible-investing (section Policies & Governance). Capital is at risk. Any claims arising out of or in connection with the terms and conditions of this disclaimer are governed by Dutch law.
To the extent it relates to custody activities, this financial promotion is disseminated by Goldman Sachs Bank Europe SE ("GSBE"), including through its authorised branches. GSBE is a credit institution incorporated in Germany and, within the Single Supervisory Mechanism established between those Member States of the European Union whose official currency is the Euro, subject to direct prudential supervision by the European Central Bank (Sonnemannstrasse 20, 60314 Frankfurt am Main, Germany) and in other respects supervised by German Federal Financial Supervisory Authority (Bundesanstalt für Finanzdienstleistungsaufsicht, BaFin) (Graurheindorfer Straße 108, 53117 Bonn, Germany; website: www.bafin.de) and Deutsche Bundesbank (Hauptverwaltung Frankfurt, Taunusanlage 5, 60329 Frankfurt am Main, Germany).
Switzerland: For Qualified Investor use only - Not for distribution to general public. This is marketing material. This document is provided to you by Goldman Sachs Bank AG, Zürich. Any future contractual relationships will be entered into with affiliates of Goldman Sachs Bank AG, which are domiciled outside of Switzerland. We would like to remind you that foreign (Non-Swiss) legal and regulatory systems may not provide the same level of protection in relation to client confidentiality and data protection as offered to you by Swiss law.
Asia excluding Japan: Please note that neither Goldman Sachs Asset Management (Hong Kong) Limited ("GSAMHK") or Goldman Sachs Asset Management (Singapore) Pte. Ltd. (Company Number: 201329851H ) ("GSAMS") nor any other entities involved in the Goldman Sachs Asset Management business that provide this material and information maintain any licenses, authorizations or registrations in Asia (other than Japan), except that it conducts businesses (subject to applicable local regulations) in and from the following jurisdictions: Hong Kong, Singapore, India and China. This material has been issued for use in or from Hong Kong by Goldman Sachs Asset Management (Hong Kong) Limited and in or from Singapore by Goldman Sachs Asset Management (Singapore) Pte. Ltd. (Company Number: 201329851H).
Australia: This material is distributed by Goldman Sachs Asset Management Australia Pty Ltd ABN 41 006 099 681, AFSL 228948 (‘GSAMA’) and is intended for viewing only by wholesale clients for the purposes of section 761G of the Corporations Act 2001 (Cth). This document may not be distributed to retail clients in Australia (as that term is defined in the Corporations Act 2001 (Cth)) or to the general public. This document may not be reproduced or distributed to any person without the prior consent of GSAMA. To the extent that this document contains any statement which may be considered to be financial product advice in Australia under the Corporations Act 2001 (Cth), that advice is intended to be given to the intended recipient of this document only, being a wholesale client for the purposes of the Corporations Act 2001 (Cth). Any advice provided in this document is provided by either of the following entities. They are exempt from the requirement to hold an Australian financial services licence under the Corporations Act of Australia and therefore do not hold any Australian Financial Services Licences, and are regulated under their respective laws applicable to their jurisdictions, which differ from Australian laws. Any financial services given to any person by these entities by distributing this document in Australia are provided to such persons pursuant to the respective ASIC Class Orders and ASIC Instrument mentioned below.
- Goldman Sachs Asset Management, LP (GSAMLP), Goldman Sachs & Co. LLC (GSCo), pursuant ASIC Class Order 03/1100; regulated by the US Securities and Exchange Commission under US laws.
- Goldman Sachs Asset Management International (GSAMI), Goldman Sachs International (GSI), pursuant to ASIC Class Order 03/1099; regulated by the Financial Conduct Authority; GSI is also authorized by the Prudential Regulation Authority, and both entities are under UK laws.
- Goldman Sachs Asset Management (Singapore) Pte. Ltd. (GSAMS), pursuant to ASIC Class Order 03/1102; regulated by the Monetary Authority of Singapore under Singaporean laws
- Goldman Sachs Asset Management (Hong Kong) Limited (GSAMHK), pursuant to ASIC Class Order 03/1103 and Goldman Sachs (Asia) LLC (GSALLC), pursuant to ASIC Instrument 04/0250; regulated by the Securities and Futures Commission of Hong Kong under Hong Kong laws
No offer to acquire any interest in a fund or a financial product is being made to you in this document. If the interests or financial products do become available in the future, the offer may be arranged by GSAMA in accordance with section 911A(2)(b) of the Corporations Act. GSAMA holds Australian Financial Services Licence No. 228948. Any offer will only be made in circumstances where disclosure is not required under Part 6D.2 of the Corporations Act or a product disclosure statement is not required to be given under Part 7.9 of the Corporations Act (as relevant).
FOR DISTRIBUTION ONLY TO FINANCIAL INSTITUTIONS, FINANCIAL SERVICES LICENSEES AND THEIR ADVISERS. NOT FOR VIEWING BY RETAIL CLIENTS OR MEMBERS OF THE GENERAL PUBLIC
Canada: This presentation has been communicated in Canada by GSAM LP, which is registered as a portfolio manager under securities legislation in all provinces of Canada and as a commodity trading manager under the commodity futures legislation of Ontario and as a derivatives adviser under the derivatives legislation of Quebec. GSAM LP is not registered to provide investment advisory or portfolio management services in respect of exchange-traded futures or options contracts in Manitoba and is not offering to provide such investment advisory or portfolio management services in Manitoba by delivery of this material.
Japan: This material has been issued or approved in Japan for the use of professional investors defined in Article 2 paragraph (31) of the Financial Instruments and Exchange Law ("FIEL"). Also, any description regarding investment strategies on or funds as collective investment scheme under Article 2 paragraph (2) item 5 or item 6 of FIEL has been approved only for Qualified Institutional Investors defined in Article 10 of Cabinet Office Ordinance of Definitions under Article 2 of FIEL.
Interest Rate Benchmark Transition Risks: This transaction may require payments or calculations to be made by reference to a benchmark rate ("Benchmark"), which will likely soon stop being published and be replaced by an alternative rate, or will be subject to substantial reform. These changes could have unpredictable and material consequences to the value, price, cost and/or performance of this transaction in the future and create material economic mismatches if you are using this transaction for hedging or similar purposes. Goldman Sachs may also have rights to exercise discretion to determine a replacement rate for the Benchmark for this transaction, including any price or other adjustments to account for differences between the replacement rate and the Benchmark, and the replacement rate and any adjustments we select may be inconsistent with, or contrary to, your interests or positions. Other material risks related to Benchmark reform can be found at https://www.gs.com/interest-rate-benchmark-transition-notice. Goldman Sachs cannot provide any assurances as to the materialization, consequences, or likely costs or expenses associated with any of the changes or risks arising from Benchmark reform, though they may be material. You are encouraged to seek independent legal, financial, tax, accounting, regulatory, or other appropriate advice on how changes to the Benchmark could impact this transaction.
Confidentiality: No part of this material may, without GSAM's prior written consent, be (i) copied, photocopied or duplicated in any form, by any means, or (ii) distributed to any person that is not an employee, officer, director, or authorized agent of the recipient.
GSAM Services Private Limited (formerly Goldman Sachs Asset Management (India) Private Limited) acts as the Investment Advisor, providing non-binding non-discretionary investment advice to dedicated offshore mandates, involving Indian and overseas securities, managed by GSAM entities based outside India. Members of the India team do not participate in the investment decision making process.