SecDb is Goldman Sachs’ platform for trading, valuation, and risk management. Originally developed by Global Markets, SecDb has been in continual use for over 30 years by over 3,000 developers. Those developers have produced over 200 million lines of Slang (the SecDb proprietary language) code and over 160 million daily jobs. SecDb applications have over 13,000 daily end users across the front, middle, and back offices. An abrupt change to how SecDb operates could have an impact on trading, risk reporting, and other bank operations.
To support those use cases, SecDb applications natively work with over 10,000 globally distributed custom object databases. This post focuses on those SecDb databases — the backbone of the ecosystem — and the observability journey that provided a more resilient and observable platform over the last three years. Our resiliency postures have changed over the years; the following sections describe that journey and how we approached changing the resiliency of a large and important legacy platform.
The databases
The SecDb ecosystem is composed of over 10,000 databases supporting over 2.5 billion connections, receiving 164 TB of messages, and serving around 8 PB of data.
SecDb databases are in-memory key-value stores, organized into an eventually consistent replication group called a ring. Applications may write to any member of a ring, which provides excellent distributed performance. Databases within a ring are synchronized by a process called SecSync, which distributes updates and detects any inconsistencies in the eventually consistent data.

Simplified diagram depicting a ring, database and SecSync
Starting point
Over the last 30 years, SecDb has gone through several iterations of monitoring technologies. In recent history, SecDb metrics used a TSDB (time-series database), which is a solution tightly coupled with SecDb. The SecDb database team (known as SecDBAs) use TSDB metrics during incidents or general investigations to diagnose a myriad of known issues, including database memory hard limits, connection limits, and others. SecDBAs also leverage PlotTool (time series plotting tool), which supplies a rich set of mathematical functions to perform operations on the data.
In this diagram, you can see the change in growth behavior for a ring with the current memory hard limit and new proposed hard limit:
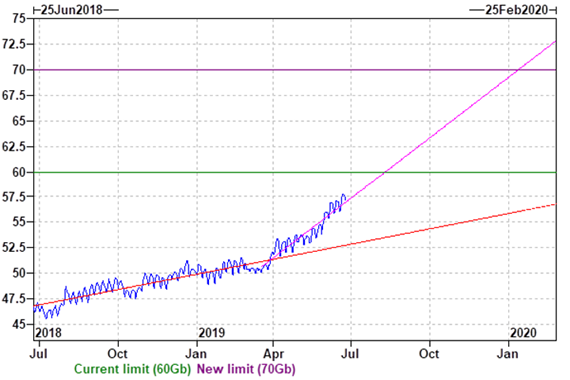
Even though the physical machine may have more physical memory, each database has its set hard limit, as there may be other databases on the same host.
TSDB and PlotTool are great tools, but they’re not a monitoring system with real-time events and escalations. They were designed for storage and analysis of financial time-series data, not to generate real-time signals for an operational system. SecDBAs used both tools to generate reports and email alerts through batch jobs. As the number of databases increased over the years, so has maintenance and the number of emails that don’t need immediate attention during critical events on the platform.
Probing
We learned how valuable TSDBs have been for the SecDBAs. We wanted to continue to leverage them and add a rule-based event engine with escalations. After discussion with the Site Reliability Engineering (SRE) team, we opted to use Prometheus to leverage the PromQL query language with Alert Manager. Due to the criticality of the databases, we implemented a probing mechanism to avoid changing the databases themselves.
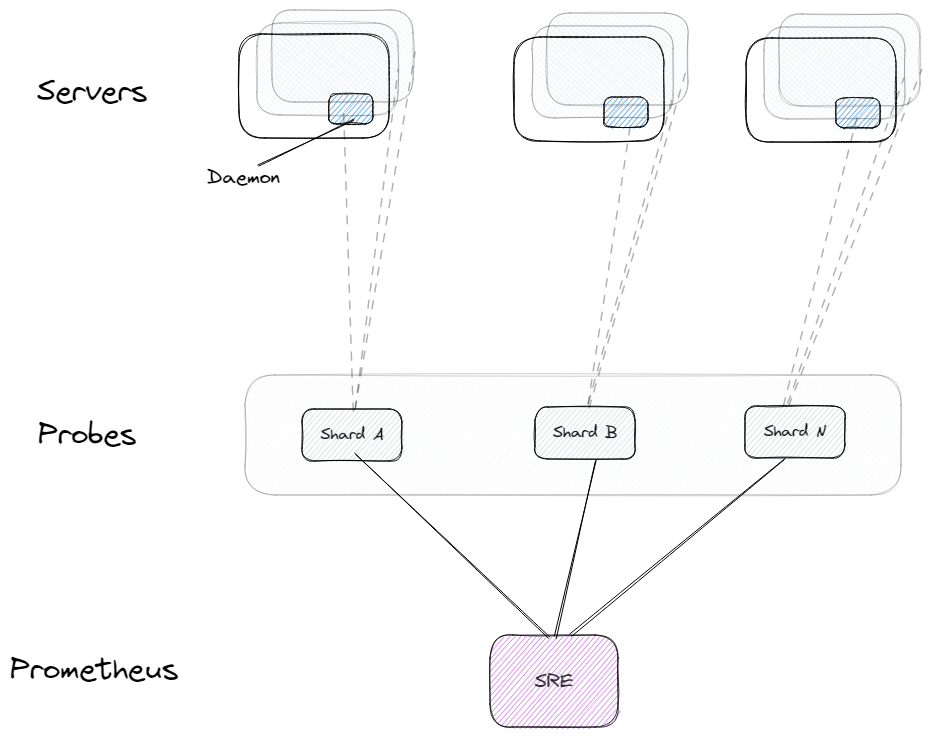
The Metrics Probe collects metrics by interacting with a daemon process that runs on every machine we manage. The probe processes the data, creates Prometheus-ready data, and exports it to a given port for the SRE-managed Prometheus instance to pick up.
As a result of the probes, we constructed dashboards for rings, hosts, and databases. We leveraged PromQL rules to create events, as some events create operational risk trackers for non-critical items, while others are escalated through PagerDuty to our on-call engineer.
Metric Server
The metrics probe provided real-time telemetry for the databases, and immediate escalations when issues occurred. The real-time nature of the alerts allowed SecDBAs to review and ask a new set of questions about the infrastructure. The new set of questions required richer telemetry that only the database internal state could provide. The Metric Server is a native database component that treats database telemetry as a first-class citizen, just like the data we store for clients.
The database is a group of processes that leverage shared memory for their state and work. The Metric Server stores its telemetry in shared memory and exposes it through a port for Prometheus to poll. When deciding to develop the server we first chose to use available libraries, but due to concurrency and locks we decided to write the component ourselves.
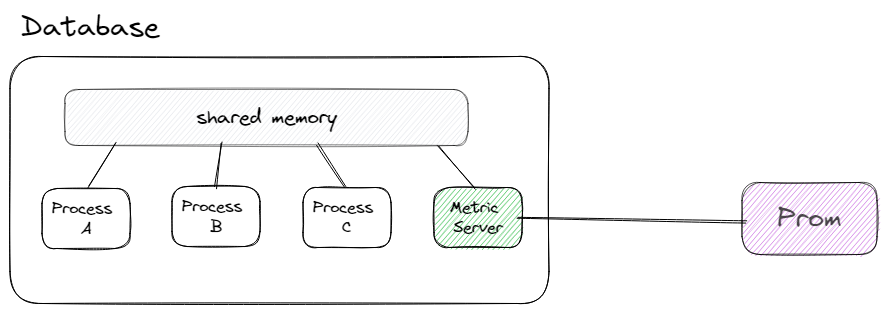
The new Metric Server allowed us to gather the internal telemetry of the database as transactions progress through its internal pipeline, giving us visibility we didn't have before.

Different database process request types
Scaling
The Metric Server opened a new door to granular telemetry that we used to collect many more service-level indicators (SLIs) per database. What was before one endpoint per host became one endpoint per database. The globally hosted SRE Prometheus requires a more static configuration for endpoints, demanding another solution for SecDb, as we move hundreds of databases across machines all the time and create new ones on-demand.
To solve this problem, we created a SecDb regional Prometheus infrastructure as an intermediary to the Global SRE Prometheus. The regional collector allowed us to dynamically update our configuration upon configuration changes to our environment. It also helped us determine what to push to SRE Prometheus for long-term storage and what to keep temporarily for quick diagnostics.

SecDb regional Prometheus setup
Access to this telemetry let us monitor more aspects of the databases — and generated more alerts. As part of the process, we started to curate the data and responses.
The SecDb team follows an around-the-sun support model, with engineers on-call to support the global nature of our businesses. Each supporting region is composed of six on-call engineers who rotate weekly and typically synchronize with the global team on pending alerts or operational tasks. To facilitate on-call rotations and more alert management, we started to use SOS to provide a seamless transition from region to region.

SOS - On-Call Rotation Tool
Metrics pipeline
Adding new metrics has become part of our normal operating process. We add new metrics due to daily investigations, or as part of our incident management process action items to prevent the same issue from occurring again. Defining new SLOs for our clients is another key factor that required new metrics. The SecDb databases publish their SLO data to the SLO Repository, a product provided by the global SRE team, that hosts the SLOs for all critical services for the firm.

Logging
The databases record two types of logs: connection logs and normal component logs. Connection logs provide details about the clients and applications connecting to the database. In some databases, there are over 150,000 simultaneous connections at a given point in time. Processing the data and analyzing it per ring over time has been difficult, so we started to ship the data to the centralized logging solution called BQL (BigQuery Logging) that’s provided by the global SRE team.
Using BQL, we can aggregate data on-demand and see how different clients start making more connections than before. Note that we don’t alert on this data; instead we monitor the number_of_connections timeseries published to Prometheus through the Metric Server, but connection details are invaluable when diagnosing issues.
We also ship application component logs to BQL to retrieve logging data from a centralized service to manage when machines fail or when processes move from one machine to another.

Sample Database Connection Logs
Looking ahead
Observability is an ever-continuing process. We continue to add more SLIs based on our day-to-day experiences, as part of our incident management process, and as our clients need new SLOs. We continue to evolve our solutions due to the ever-changing nature of the business and the need to further reduce toil.
In 2023 and 2024 we extend the Observability effort beyond the databases to all the other products under the SecDb Platform. This exciting journey will present a new set of challenges as we deal with a different set of products. Stay tuned for an update on the new journey as we execute it!
Interested in solving complex problems? Learn more about engineering careers at Goldman Sachs.
See https://www.gs.com/disclaimer/global_email for important risk disclosures, conflicts of interest, and other terms and conditions relating to this blog and your reliance on information contained in it.
Solutions
Curated Data Security MasterData AnalyticsPlotTool ProPortfolio AnalyticsGS QuantTransaction BankingGS DAP®Liquidity Investing¹ Real-time data can be impacted by planned system maintenance, connectivity or availability issues stemming from related third-party service providers, or other intermittent or unplanned technology issues.
Transaction Banking services are offered by Goldman Sachs Bank USA ("GS Bank") and its affiliates. GS Bank is a New York State chartered bank, a member of the Federal Reserve System and a Member FDIC. For additional information, please see Bank Regulatory Information.
² Source: Goldman Sachs Asset Management, as of March 31, 2025.
Mosaic is a service mark of Goldman Sachs & Co. LLC. This service is made available in the United States by Goldman Sachs & Co. LLC and outside of the United States by Goldman Sachs International, or its local affiliates in accordance with applicable law and regulations. Goldman Sachs International and Goldman Sachs & Co. LLC are the distributors of the Goldman Sachs Funds. Depending upon the jurisdiction in which you are located, transactions in non-Goldman Sachs money market funds are affected by either Goldman Sachs & Co. LLC, a member of FINRA, SIPC and NYSE, or Goldman Sachs International. For additional information contact your Goldman Sachs representative. Goldman Sachs & Co. LLC, Goldman Sachs International, Goldman Sachs Liquidity Solutions, Goldman Sachs Asset Management, L.P., and the Goldman Sachs funds available through Goldman Sachs Liquidity Solutions and other affiliated entities, are under the common control of the Goldman Sachs Group, Inc.
Goldman Sachs & Co. LLC is a registered U.S. broker-dealer and futures commission merchant, and is subject to regulatory capital requirements including those imposed by the SEC, the U.S. Commodity Futures Trading Commission (CFTC), the Chicago Mercantile Exchange, the Financial Industry Regulatory Authority, Inc. and the National Futures Association.
FOR INSTITUTIONAL USE ONLY - NOT FOR USE AND/OR DISTRIBUTION TO RETAIL AND THE GENERAL PUBLIC.
This material is for informational purposes only. It is not an offer or solicitation to buy or sell any securities.
THIS MATERIAL DOES NOT CONSTITUTE AN OFFER OR SOLICITATION IN ANY JURISDICTION WHERE OR TO ANY PERSON TO WHOM IT WOULD BE UNAUTHORIZED OR UNLAWFUL TO DO SO. Prospective investors should inform themselves as to any applicable legal requirements and taxation and exchange control regulations in the countries of their citizenship, residence or domicile which might be relevant. This material is provided for informational purposes only and should not be construed as investment advice or an offer or solicitation to buy or sell securities. This material is not intended to be used as a general guide to investing, or as a source of any specific investment recommendations, and makes no implied or express recommendations concerning the manner in which any client's account should or would be handled, as appropriate investment strategies depend upon the client's investment objectives.
United Kingdom: In the United Kingdom, this material is a financial promotion and has been approved by Goldman Sachs Asset Management International, which is authorized and regulated in the United Kingdom by the Financial Conduct Authority.
European Economic Area (EEA): This marketing communication is disseminated by Goldman Sachs Asset Management B.V., including through its branches ("GSAM BV"). GSAM BV is authorised and regulated by the Dutch Authority for the Financial Markets (Autoriteit Financiële Markten, Vijzelgracht 50, 1017 HS Amsterdam, The Netherlands) as an alternative investment fund manager ("AIFM") as well as a manager of undertakings for collective investment in transferable securities ("UCITS"). Under its licence as an AIFM, the Manager is authorized to provide the investment services of (i) reception and transmission of orders in financial instruments; (ii) portfolio management; and (iii) investment advice. Under its licence as a manager of UCITS, the Manager is authorized to provide the investment services of (i) portfolio management; and (ii) investment advice.
Information about investor rights and collective redress mechanisms are available on www.gsam.com/responsible-investing (section Policies & Governance). Capital is at risk. Any claims arising out of or in connection with the terms and conditions of this disclaimer are governed by Dutch law.
To the extent it relates to custody activities, this financial promotion is disseminated by Goldman Sachs Bank Europe SE ("GSBE"), including through its authorised branches. GSBE is a credit institution incorporated in Germany and, within the Single Supervisory Mechanism established between those Member States of the European Union whose official currency is the Euro, subject to direct prudential supervision by the European Central Bank (Sonnemannstrasse 20, 60314 Frankfurt am Main, Germany) and in other respects supervised by German Federal Financial Supervisory Authority (Bundesanstalt für Finanzdienstleistungsaufsicht, BaFin) (Graurheindorfer Straße 108, 53117 Bonn, Germany; website: www.bafin.de) and Deutsche Bundesbank (Hauptverwaltung Frankfurt, Taunusanlage 5, 60329 Frankfurt am Main, Germany).
Switzerland: For Qualified Investor use only - Not for distribution to general public. This is marketing material. This document is provided to you by Goldman Sachs Bank AG, Zürich. Any future contractual relationships will be entered into with affiliates of Goldman Sachs Bank AG, which are domiciled outside of Switzerland. We would like to remind you that foreign (Non-Swiss) legal and regulatory systems may not provide the same level of protection in relation to client confidentiality and data protection as offered to you by Swiss law.
Asia excluding Japan: Please note that neither Goldman Sachs Asset Management (Hong Kong) Limited ("GSAMHK") or Goldman Sachs Asset Management (Singapore) Pte. Ltd. (Company Number: 201329851H ) ("GSAMS") nor any other entities involved in the Goldman Sachs Asset Management business that provide this material and information maintain any licenses, authorizations or registrations in Asia (other than Japan), except that it conducts businesses (subject to applicable local regulations) in and from the following jurisdictions: Hong Kong, Singapore, India and China. This material has been issued for use in or from Hong Kong by Goldman Sachs Asset Management (Hong Kong) Limited and in or from Singapore by Goldman Sachs Asset Management (Singapore) Pte. Ltd. (Company Number: 201329851H).
Australia: This material is distributed by Goldman Sachs Asset Management Australia Pty Ltd ABN 41 006 099 681, AFSL 228948 (‘GSAMA’) and is intended for viewing only by wholesale clients for the purposes of section 761G of the Corporations Act 2001 (Cth). This document may not be distributed to retail clients in Australia (as that term is defined in the Corporations Act 2001 (Cth)) or to the general public. This document may not be reproduced or distributed to any person without the prior consent of GSAMA. To the extent that this document contains any statement which may be considered to be financial product advice in Australia under the Corporations Act 2001 (Cth), that advice is intended to be given to the intended recipient of this document only, being a wholesale client for the purposes of the Corporations Act 2001 (Cth). Any advice provided in this document is provided by either of the following entities. They are exempt from the requirement to hold an Australian financial services licence under the Corporations Act of Australia and therefore do not hold any Australian Financial Services Licences, and are regulated under their respective laws applicable to their jurisdictions, which differ from Australian laws. Any financial services given to any person by these entities by distributing this document in Australia are provided to such persons pursuant to the respective ASIC Class Orders and ASIC Instrument mentioned below.
- Goldman Sachs Asset Management, LP (GSAMLP), Goldman Sachs & Co. LLC (GSCo), pursuant ASIC Class Order 03/1100; regulated by the US Securities and Exchange Commission under US laws.
- Goldman Sachs Asset Management International (GSAMI), Goldman Sachs International (GSI), pursuant to ASIC Class Order 03/1099; regulated by the Financial Conduct Authority; GSI is also authorized by the Prudential Regulation Authority, and both entities are under UK laws.
- Goldman Sachs Asset Management (Singapore) Pte. Ltd. (GSAMS), pursuant to ASIC Class Order 03/1102; regulated by the Monetary Authority of Singapore under Singaporean laws
- Goldman Sachs Asset Management (Hong Kong) Limited (GSAMHK), pursuant to ASIC Class Order 03/1103 and Goldman Sachs (Asia) LLC (GSALLC), pursuant to ASIC Instrument 04/0250; regulated by the Securities and Futures Commission of Hong Kong under Hong Kong laws
No offer to acquire any interest in a fund or a financial product is being made to you in this document. If the interests or financial products do become available in the future, the offer may be arranged by GSAMA in accordance with section 911A(2)(b) of the Corporations Act. GSAMA holds Australian Financial Services Licence No. 228948. Any offer will only be made in circumstances where disclosure is not required under Part 6D.2 of the Corporations Act or a product disclosure statement is not required to be given under Part 7.9 of the Corporations Act (as relevant).
FOR DISTRIBUTION ONLY TO FINANCIAL INSTITUTIONS, FINANCIAL SERVICES LICENSEES AND THEIR ADVISERS. NOT FOR VIEWING BY RETAIL CLIENTS OR MEMBERS OF THE GENERAL PUBLIC
Canada: This presentation has been communicated in Canada by GSAM LP, which is registered as a portfolio manager under securities legislation in all provinces of Canada and as a commodity trading manager under the commodity futures legislation of Ontario and as a derivatives adviser under the derivatives legislation of Quebec. GSAM LP is not registered to provide investment advisory or portfolio management services in respect of exchange-traded futures or options contracts in Manitoba and is not offering to provide such investment advisory or portfolio management services in Manitoba by delivery of this material.
Japan: This material has been issued or approved in Japan for the use of professional investors defined in Article 2 paragraph (31) of the Financial Instruments and Exchange Law ("FIEL"). Also, any description regarding investment strategies on or funds as collective investment scheme under Article 2 paragraph (2) item 5 or item 6 of FIEL has been approved only for Qualified Institutional Investors defined in Article 10 of Cabinet Office Ordinance of Definitions under Article 2 of FIEL.
Interest Rate Benchmark Transition Risks: This transaction may require payments or calculations to be made by reference to a benchmark rate ("Benchmark"), which will likely soon stop being published and be replaced by an alternative rate, or will be subject to substantial reform. These changes could have unpredictable and material consequences to the value, price, cost and/or performance of this transaction in the future and create material economic mismatches if you are using this transaction for hedging or similar purposes. Goldman Sachs may also have rights to exercise discretion to determine a replacement rate for the Benchmark for this transaction, including any price or other adjustments to account for differences between the replacement rate and the Benchmark, and the replacement rate and any adjustments we select may be inconsistent with, or contrary to, your interests or positions. Other material risks related to Benchmark reform can be found at https://www.gs.com/interest-rate-benchmark-transition-notice. Goldman Sachs cannot provide any assurances as to the materialization, consequences, or likely costs or expenses associated with any of the changes or risks arising from Benchmark reform, though they may be material. You are encouraged to seek independent legal, financial, tax, accounting, regulatory, or other appropriate advice on how changes to the Benchmark could impact this transaction.
Confidentiality: No part of this material may, without GSAM's prior written consent, be (i) copied, photocopied or duplicated in any form, by any means, or (ii) distributed to any person that is not an employee, officer, director, or authorized agent of the recipient.
GSAM Services Private Limited (formerly Goldman Sachs Asset Management (India) Private Limited) acts as the Investment Advisor, providing non-binding non-discretionary investment advice to dedicated offshore mandates, involving Indian and overseas securities, managed by GSAM entities based outside India. Members of the India team do not participate in the investment decision making process.