Sustainable Investing - Why is it important?
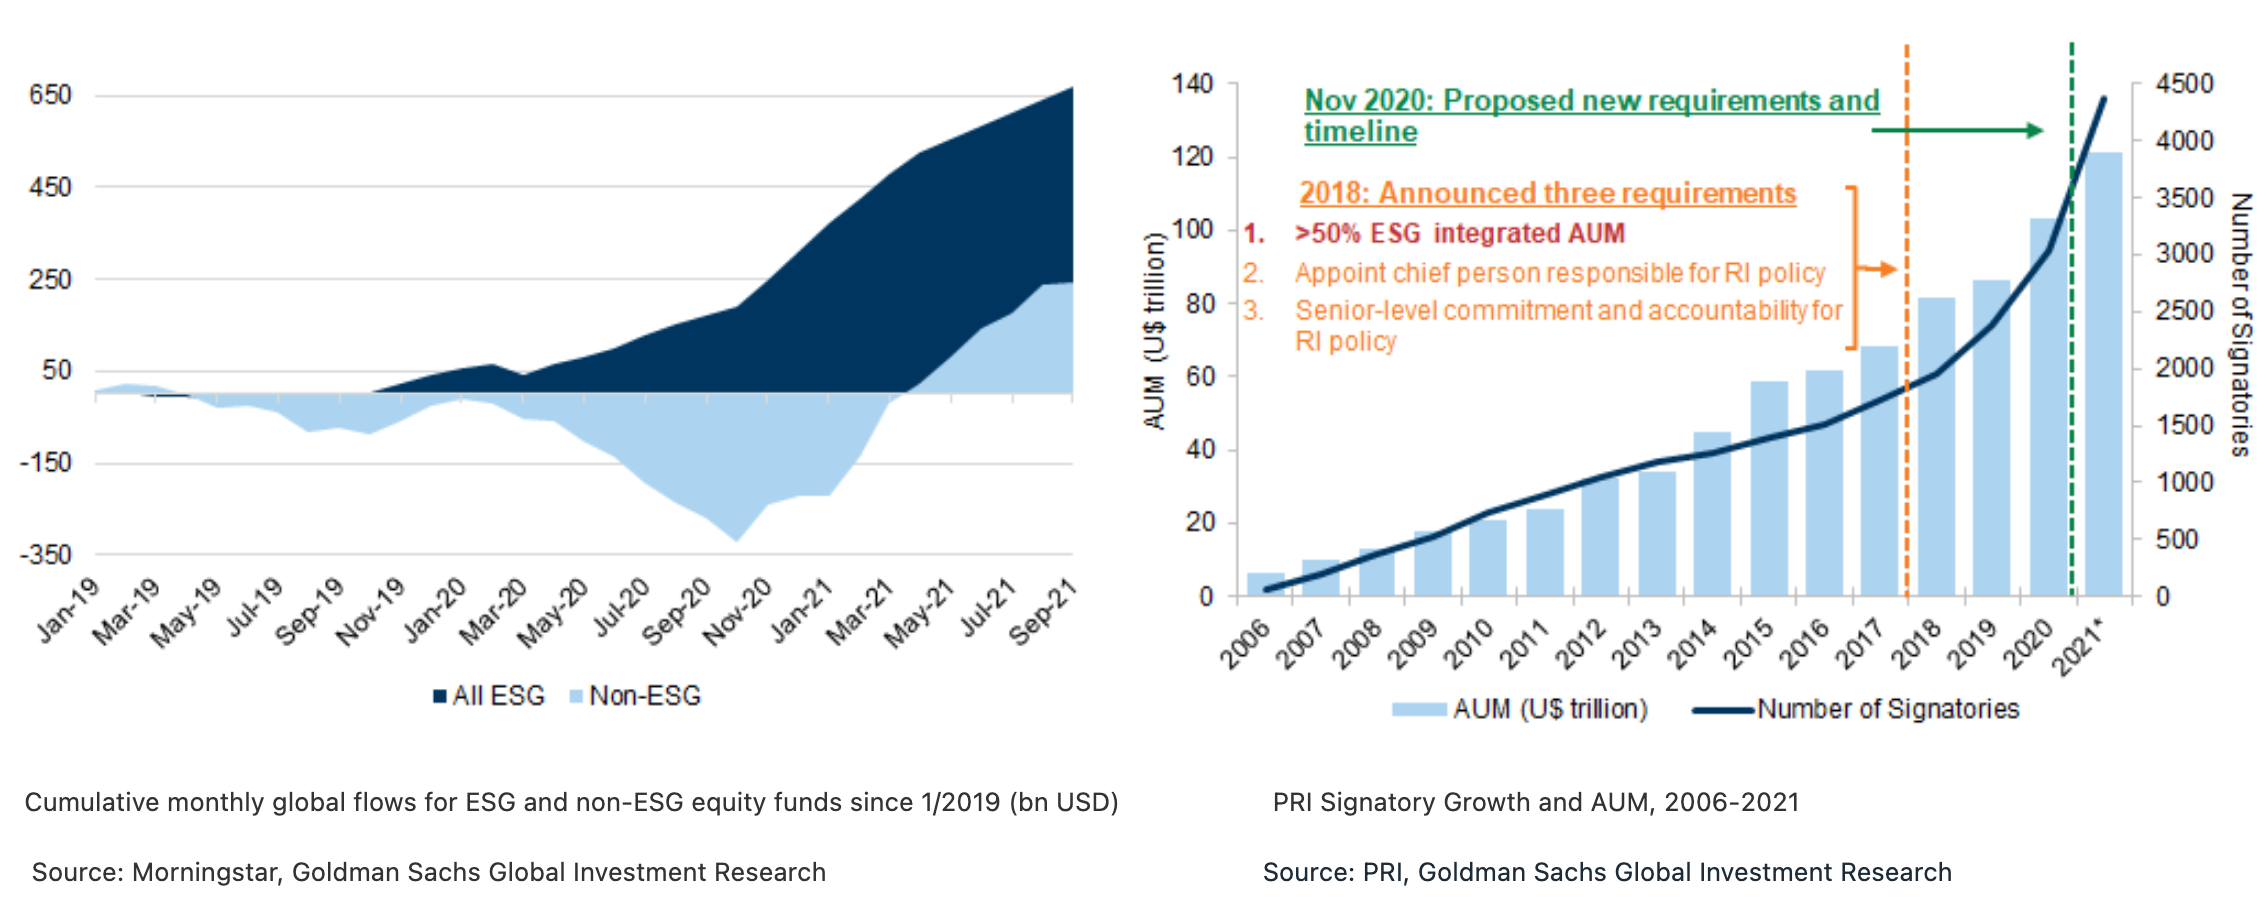
With increasing interest, activity and regulation in Environmental, Social, and Governance (ESG) and impact investing, clients are seeking ways to enhance the ESG alignment of their investments and have a positive impact while generating financial return. According to "The PM's Guide to the ESG Revolution III", research published by Goldman Sach's Global Investment Research published in November 2021, the number of Principles for Responsible Investing (PRI) signatories and Assets Under Management (AUM) has continued to accelerate, with more than 4,375 signatories representing a total AUM of $121 trillion. In November 2020, PRI proposed a set of increased requirements, including having the Responsible Investing (RI) policy cover >90% of their AUM, and incorporating ESG in all asset classes in which at least U$10 billion is invested, or >10% of AUM, among others. Signatory AUM growth has certainly been a reflection of the growth in global markets in recent years, but is also something we see corresponding with fund flows - ESG flows through September 2021 were $367bn, well ahead of 2020's full-year total of $269 bn.
Goldman Sachs Leadership in ESG space
Goldman Sachs has a long-standing commitment to address the impacts of climate change and drive the transition to a low-carbon economy. Over 15 years ago, the firm led the industry as one of the first major banks to acknowledge the scale and urgency of climate change. Since then, we have double downed on our efforts to integrate sustainability across our businesses, prioritizing climate transition and inclusive growth in our commercial efforts with clients.
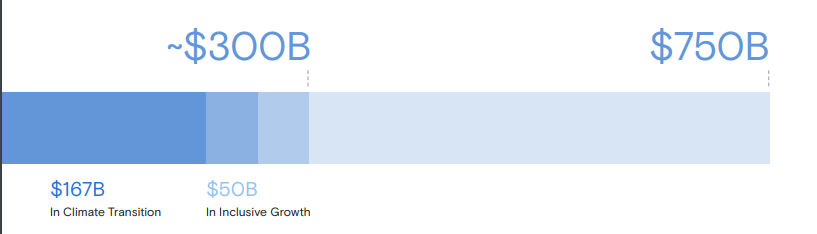
At Goldman Sachs, oversight for ESG sits with both the Goldman Sachs Board, through ESG-related policies and the firm's annual Sustainability Report, as well as embedded within our businesses. In 2019, the firm developed a framework to put climate transition and inclusive growth, the two key pillars of our sustainability strategy, at the forefront of our work with clients. And to demonstrate the depth of our commitment, the firm announced that we would target $750 billion in financing, investing, and advisory activity to nine areas focused on these two priorities by 2030. As of the end of December 2021, we’ve achieved approximately $300 billion, including $167 billion in climate transition, $50 billion in inclusive growth, and the remainder in multiple themes.
Challenges within ESG space and Solutions Offered by Goldman Sachs
Implementing ESG practices is not an easy task but we know deeply that it is worth our attention. Within ESG it is difficult to:
- Choose data: There are numerous metrics within each of the E,S, and G factors. Understanding what are the appropriate metrics that will ultimately produce desired outcomes can be difficult.
- Find data: As ESG is a relatively new space, data is either not complete, lacks history or does not adhere to the framework you may have in mind. Many new data vendors are entering the market and existing ones are creating new datasets to meet a wide range of use cases.
- Structure data: Most of the data that is used to compute ESG metrics is scattered across in PDFs, company reports and disclosures. The unstructured nature of the data makes it hard to ingest and analyze quickly.
- Verify data: Verifying reported data against history, consistency and coverage is often laborious, as it usually involves understanding the data collection methodologies and data certification processes. Providing business stakeholders and subject matter experts easy, quick and intuitive access to data is a challenge.
- Integrate data: In order to incorporate ESG information into business workflows, it is also critical to supplement ESG data with data describing corporate structures and investable entities.
All of the factors above require rapid prototyping of the data models without compromising data quality and security.
The Solution: Goldman Sachs ESG Beacon Team Champions Rapid Prototyping
Our client-facing teams, quants, as well as data and software engineers have partnered to make an impact and change the world for better. ESG Beacon is an effort within the firm that originated out of GS Accelerate, the firm's internal incubator and innovation platform. ESG Beacon focuses solely on addressing the ESG data needs of businesses to help them perform rapid prototyping and ultimately decrease time to market to directly help our clients in their investment goals. ESG Beacon proactively sources, ingests, models and delivers the data to businesses across the firm. Our engineers are building platforms and APIs with the highest standards to ensure data quality and governance, while also minimizing the time to market. All of this work is built in-house and leverages our open source Legend data platform (to learn more about Legend, explore a previous GS Developer post: Building Platforms for Data Engineering).
Carbon Analytics Use Case Technical Deep Dive
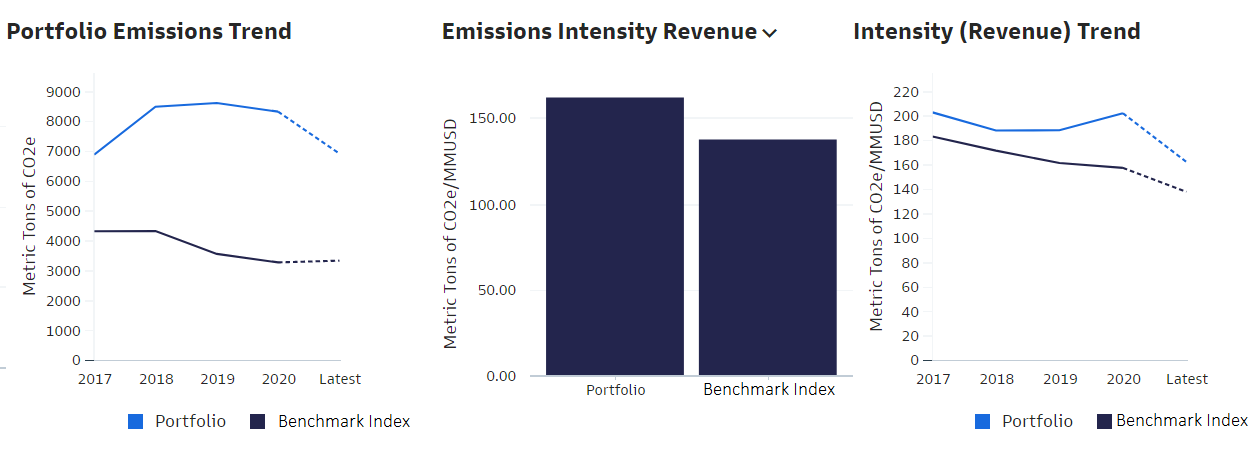
One use case that demonstrates our approach to a more sustainable future is the Global Markets Division's Carbon Analytics Tool on Marquee, which is a quantitative application to help clients measure and manage carbon exposures across their equities and credit portfolios while controlling their overall risk exposure.
Carbon emissions intensity is a metric that is used to assess and compare against a benchmark. One method to calculate carbon emissions intensity is to divide the total carbon emissions by the revenue of the company to normalize the metric against companies of different sizes in terms of revenue. Investors seeking to invest in "greener" companies in a sector would favor those with a lower emissions intensity.
Sample visualizations are shown below:
For the above visualization, data has been sourced from multiple vendors:
- Carbon Emissions: As-reported and estimated greenhouse gas emissions data for global public and private companies. This dataset leverages an extensive range of company data such as financial and non-financial disclosure data to estimate scope 1, 2 and 3 emissions for companies.
- Company Fundamentals: As-reported, standardized, and adjusted fields from income statements, balance sheets, cash flow statements, and ratio values covering the entire financial reporting process.
Analytics teams across various divisions depend on third party vendor data to run their daily businesses. When they need to ingest entirely new or modified vendor data feeds, it often starts as an expensive and resource-intensive process. When we use traditional data delivery methods like FTP file delivery or vendor APIs, it is necessary to build bespoke data pipelines and engage resources in order to monitor and maintain them. This whole process takes months to design, develop and deploy. To streamline this process we have adopted the following practices, all leveraging our Legend platform:
- Establishing a Centralized Vendor Data Store with cloud based platforms and marketplaces as preferred source
- Using a common data modelling paradigm to express transformation and business logic
- Implement appropiate entitlements and access controls depending upon data contractual obligations
- Providing easy interfaces, both programmatic and low code to enable a wide pool of user personas like researchers and engineers to self serve data
Let's dig in further on data sourcing, data architecture, and data modelling.
Data Sourcing
Currently the firm maintains various bilateral direct connections to source vendors via traditional data transfer mechanisms like SFX/FTP etc. Our preference is to reduce the number of these direct connections where possible and to instead leverage data exchanges, marketplaces and third party aggregators, where data flows from cloud-native ingestion points and scalable APIs. There are many permutations and combinations for how and where we can consume data before it is made centrally available by data engineering. One of the common practices that we have adopted is Secure Data Sharing between supplier and our cloud data warehouses, which eliminates the need to create or support any ETL data pipeline for first couple of miles of vendor data ingestion. This ensures that developers time is being spent in value-add tasks such as describing the data, making connections between the data etc. as opposed to setting up infrastructure on non-differentiated tasks.
Data Architecture
The diagram below illustrates the flow of data from the vendor, through our data warehouse and the Legend data platform, and into consumer queries and applications.

Data Modeling
Our data models are powered by the Legend Data Platform, which serves as a one-stop-shop for modelling, transforming and exposing data for various analytical needs. Legend caters to both "low-code" users, comfortable with Excel, analytics dashboards, and programmatic users who consume via APIs in various applications.
When we talk about data models, we mean a logical representation of the data that resides in the GS Vendor Data Store. There are many ways to express data models, for example, it can be through SQL data definition and manipulation statements, python code containing transformation logic, configuration files in semi-structured format like JSON or XML etc., all of which is widely used in different database and ETL technologies. We built and open sourced our own Domain Specific Language called Pure (a functional language that is shipped as part of our open source Legend platform) which acts as a modelling paradigm for all definitions and transformations irrespective of where the data resides physically. The language is integrated into Legend Studio which is our collaborative tool that enables a wide range of users, engineers and analysts alike, to use this data modelling paradigm in a low-code, visually intuitive, interactive UI or switch back to a programming interface, all back by a Git-powered Software Development Lifecycle. This helps us bring the right governance, consistency, transparency and data lineage across the board for all user interactions with data.
Basic Legend Data Model
In our example of the Legend Data Model of ESG Emissions, we will show how we capture physical layout of the data in GS Vendor Data Store, and the logical abstraction of how we want to use the data in our application and the mapping between the two.
First we start with the physical representation of the database table with schema, tables and columns
Programmatic Representation of Legend Data Store
###Relational
Database Vendor::ESGStore
(
  Schema USER_VIEW
  (
    Table ESG_EMISSIONS_HISTORY
    (
      "COMPANY_ID" NUMERIC(38, 0) PRIMARY KEY,
      "COMPANY_ID_GLOBAL" VARCHAR(36),
      "COMPANY_NAME_GLOBAL" VARCHAR(300),
      "CONSOLIDATED_INDICATOR" VARCHAR(12) PRIMARY KEY,
      "FISCAL_YEAR_PERIOD" VARCHAR(50) PRIMARY KEY,
      "GHG_EMISSIONS_SCOPE_1" FLOAT,
      "GHG_EMISSIONS_SCOPE_2" FLOAT,
      "TOTAL_EMISSIONS" FLOAT,
      "CO2_EMISSIONS_DIRECT" FLOAT,
      "CO2_EMISSIONS_INDIRECT" FLOAT,
      "CO2_EMISSIONS_TOTAL" FLOAT
    )
  )
Then comes the logical abstraction in form of a class. Below is a screenshot of how the ESG Class looks in Legend Studio:
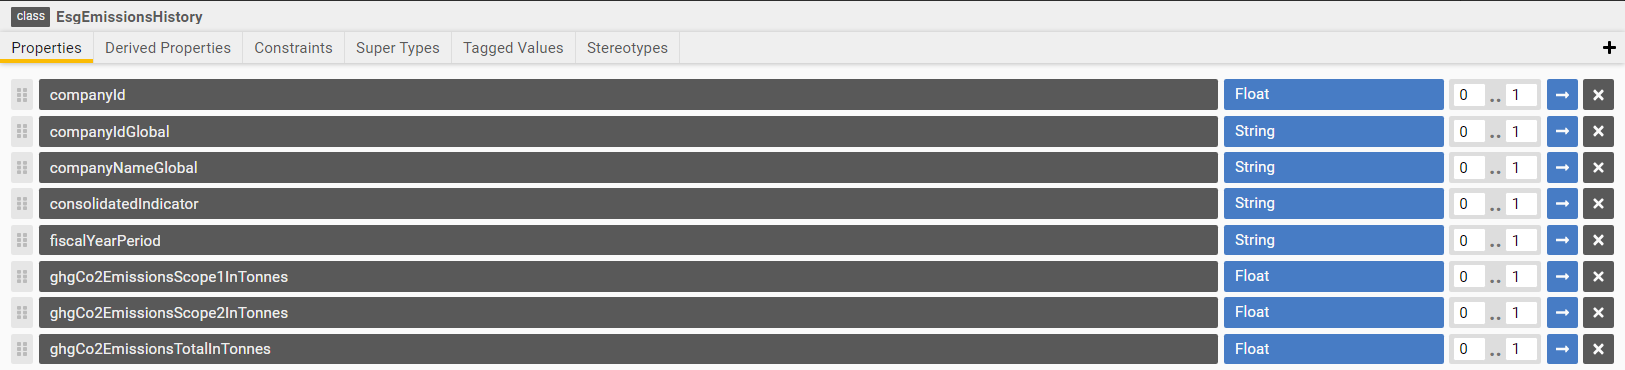
Programmatic representation of ESG Class
###Pure
Class Vendor::EsgEmissionsHistory
{
  companyId: Float[0..1];
  companyIdGlobal: String[0..1];
  companyNameGlobal: String[0..1];
  consolidatedIndicator: String[0..1];
  fiscalYearPeriod: String[0..1];
  ghgCo2EmissionsScope1InTonnes: Float[0..1];
  ghgCo2EmissionsScope2InTonnes: Float[0..1];
  ghgCo2EmissionsTotalInTonnes: Float[0..1];
}
And now we define a mapping between the logical data model and the physical data store. Mapping not only defines the relationship between a class attribute and a database field but also is a good place to embed any transformation or business logic.
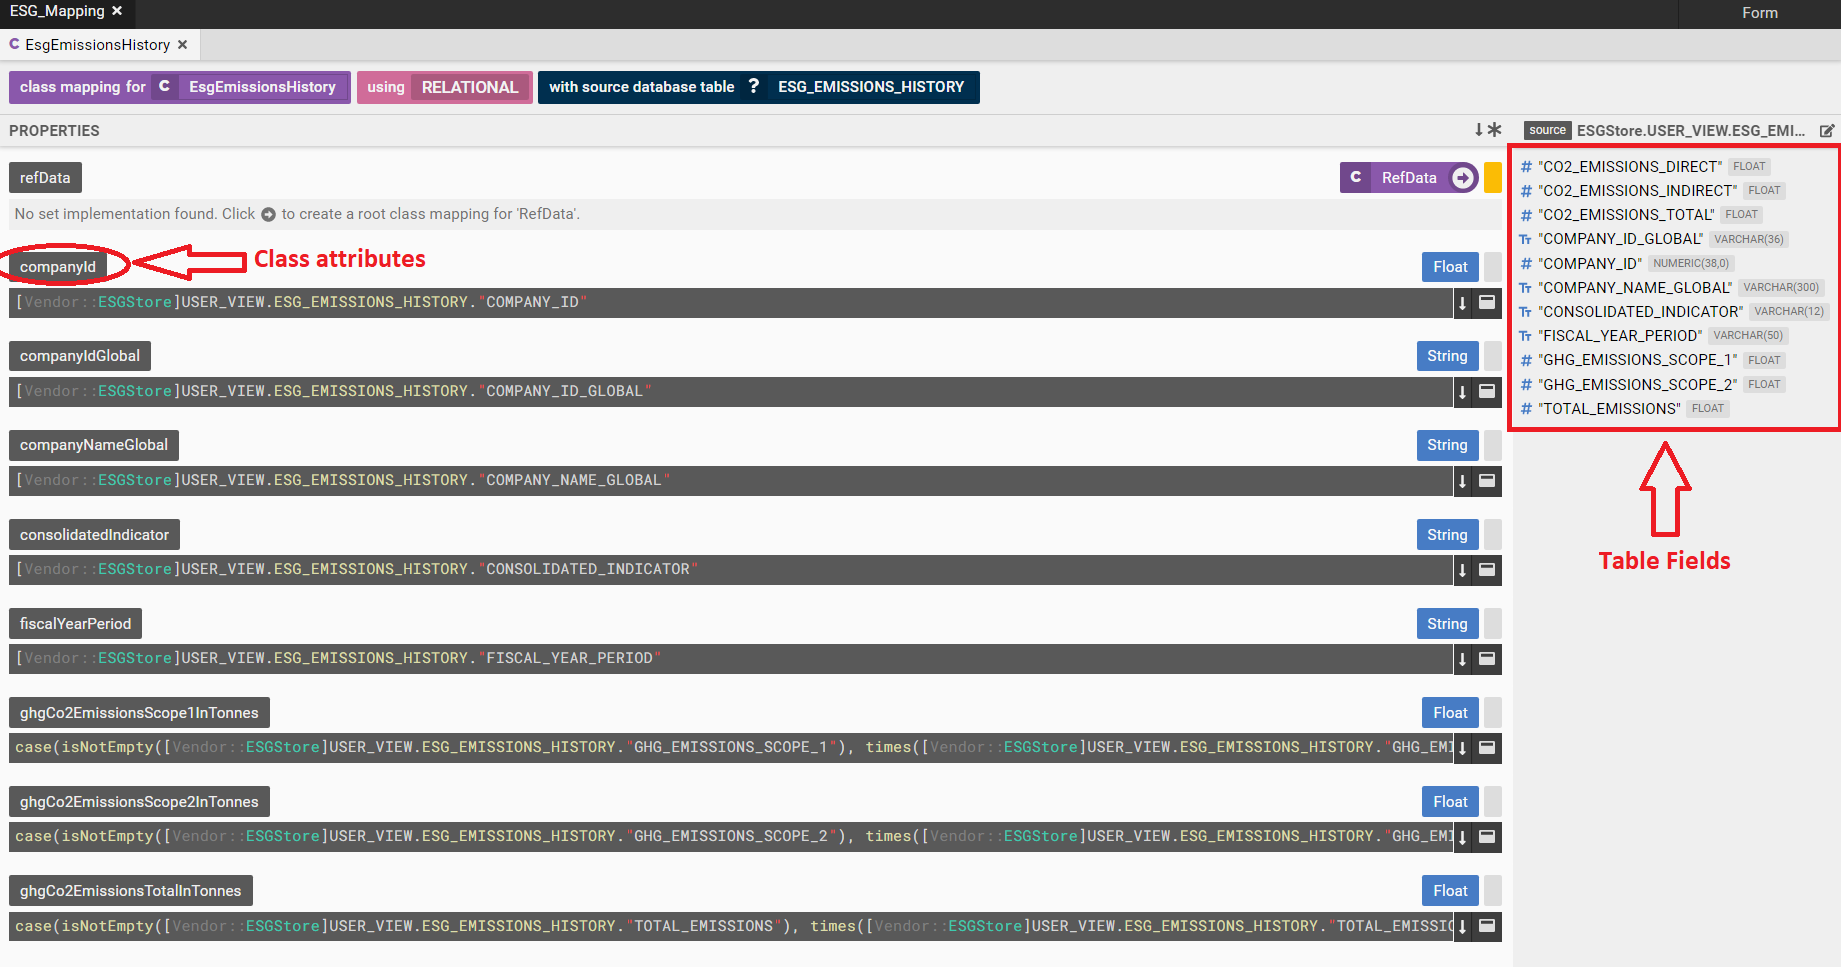
Test Data can be embedded in the mapping as well.
Programmatic representation of ESG Data Mapping
[###Mapping
Mapping Vendor::ESG_Mapping
(
Vendor::EsgEmissionsHistory: Relational
{
~primaryKey
(
[Vendor::ESGStore]USER_VIEW.ESG_EMISSIONS_HISTORY."COMPANY_ID",
[Vendor::ESGStore]USER_VIEW.ESG_EMISSIONS_HISTORY."CONSOLIDATED_INDICATOR",
[Vendor::ESGStore]USER_VIEW.ESG_EMISSIONS_HISTORY."FISCAL_YEAR_PERIOD"
)
~mainTable [Vendor::ESGStore]USER_VIEW.ESG_EMISSIONS_HISTORY
companyId: [Vendor::ESGStore]USER_VIEW.ESG_EMISSIONS_HISTORY."COMPANY_ID",
companyIdGlobal: [Vendor::ESGStore]USER_VIEW.ESG_EMISSIONS_HISTORY."COMPANY_ID_GLOBAL",
companyNameGlobal: [Vendor::ESGStore]USER_VIEW.ESG_EMISSIONS_HISTORY."COMPANY_NAME_GLOBAL",
consolidatedIndicator: [Vendor::ESGStore]USER_VIEW.ESG_EMISSIONS_HISTORY."CONSOLIDATED_INDICATOR",
fiscalYearPeriod: [Vendor::ESGStore]USER_VIEW.ESG_EMISSIONS_HISTORY."FISCAL_YEAR_PERIOD",
ghgCo2EmissionsScope1InTonnes: case(isNotEmpty([Vendor::ESGStore]USER_VIEW.ESG_EMISSIONS_HISTORY."GHG_EMISSIONS_SCOPE_1"), times([Vendor::ESGStore]USER_VIEW.ESG_EMISSIONS_HISTORY."GHG_EMISSIONS_SCOPE_1", 1000), times([Vendor::ESGStore]USER_VIEW.ESG_EMISSIONS_HISTORY."CO2_EMISSIONS_DIRECT", 1000)),
ghgCo2EmissionsScope2InTonnes: case(isNotEmpty([Vendor::ESGStore]USER_VIEW.ESG_EMISSIONS_HISTORY."GHG_EMISSIONS_SCOPE_2"), times([Vendor::ESGStore]USER_VIEW.ESG_EMISSIONS_HISTORY."GHG_EMISSIONS_SCOPE_2", 1000), times([Vendor::ESGStore]USER_VIEW.ESG_EMISSIONS_HISTORY."CO2_EMISSIONS_INDIRECT", 1000)),
ghgCo2EmissionsTotalInTonnes: case(isNotEmpty([Vendor::ESGStore]USER_VIEW.ESG_EMISSIONS_HISTORY."TOTAL_EMISSIONS"), times([Vendor::ESGStore]USER_VIEW.ESG_EMISSIONS_HISTORY."TOTAL_EMISSIONS", 1000), times([Vendor::ESGStore]USER_VIEW.ESG_EMISSIONS_HISTORY."CO2_EMISSIONS_TOTAL", 1000))
}
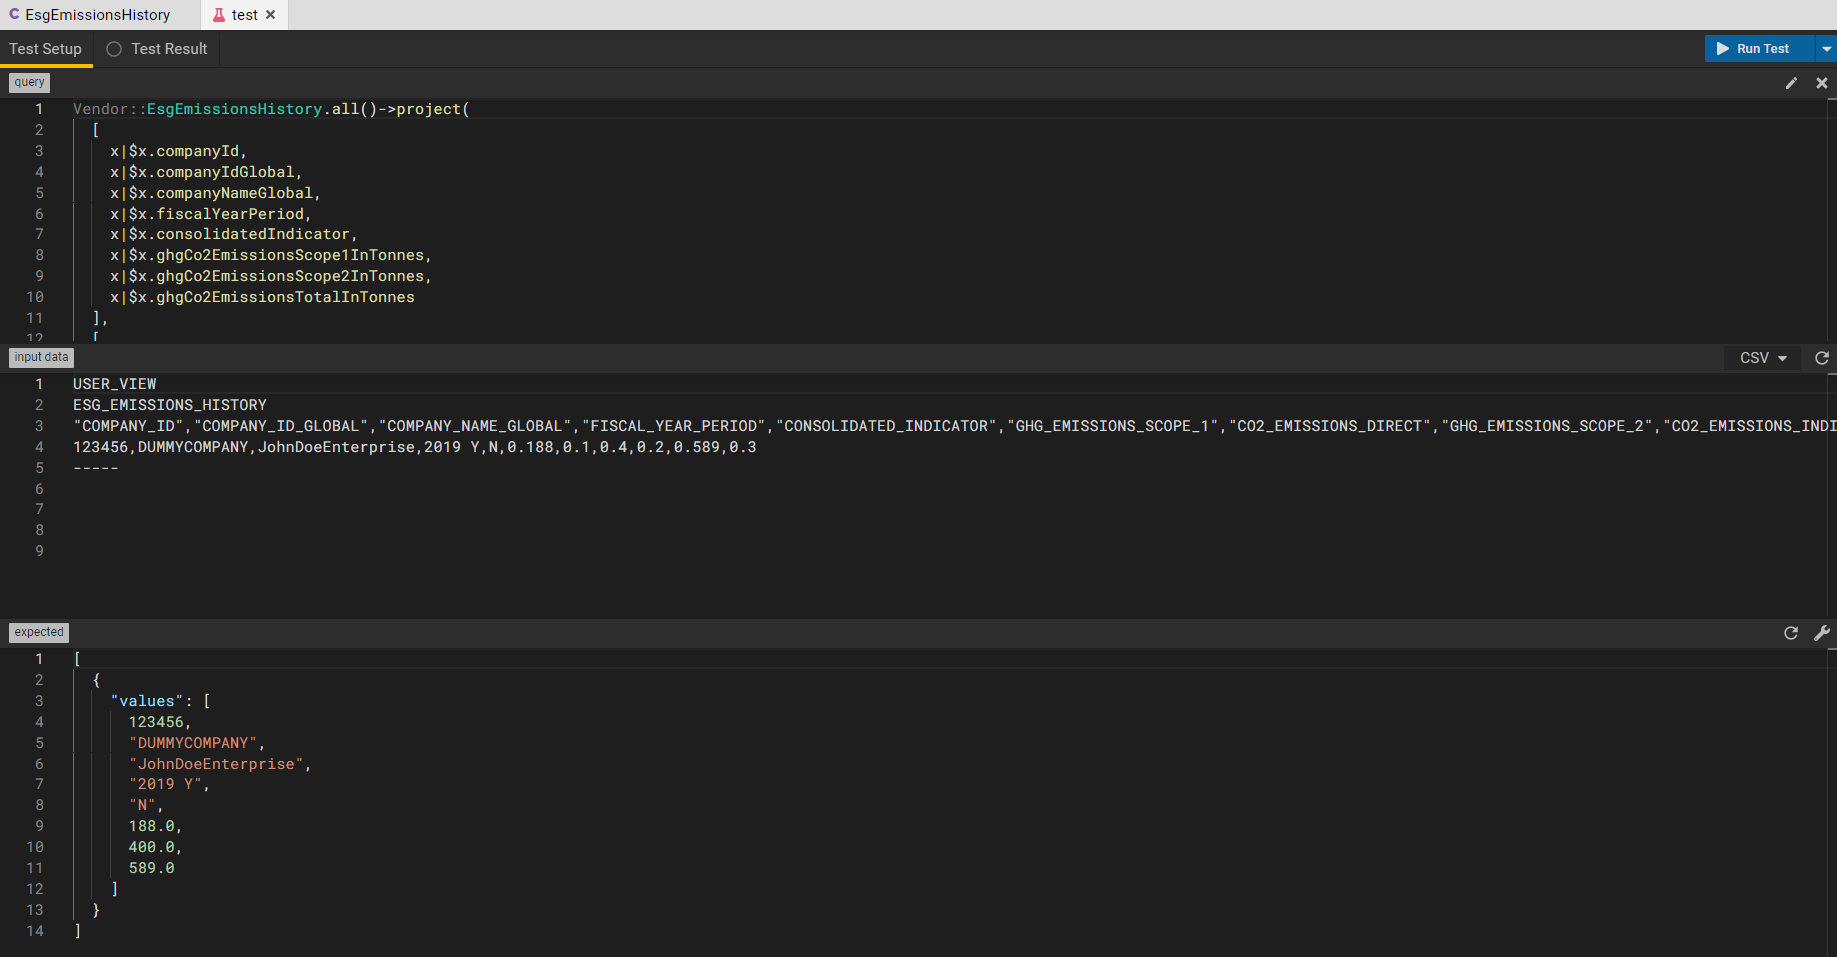
MappingTests
[
test
(
query: |Vendor::EsgEmissionsHistory.all()->project([x|$x.companyId, x|$x.companyIdGlobal, x|$x.companyNameGlobal, x|$x.fiscalYearPeriod, x|$x.consolidatedIndicator, x|$x.ghgCo2EmissionsScope1InTonnes, x|$x.ghgCo2EmissionsScope2InTonnes, x|$x.ghgCo2EmissionsTotalInTonnes], ['Company Id', 'Company Id Global', 'Company Name Global', 'Fiscal Year Period', 'Consolidated Indicator', 'ghgCo2EmissionsScope1InTonnes', 'ghgCo2EmissionsScope2InTonnes', 'ghgCo2EmissionsTotalInTonnes']);
data:
[
<Relational, CSV, Vendor::ESGStore,
'USER_VIEW\n'+
'ESG_EMISSIONS_HISTORY\n'+
'"COMPANY_ID","COMPANY_ID_GLOBAL","COMPANY_NAME_GLOBAL","FISCAL_YEAR_PERIOD","CONSOLIDATED_INDICATOR","GHG_EMISSIONS_SCOPE_1","CO2_EMISSIONS_DIRECT","GHG_EMISSIONS_SCOPE_2","CO2_EMISSIONS_INDIRECT","TOTAL_EMISSIONS","CO2_EMISSIONS_TOTAL"\n'+
'123456,DUMMYCOMPANY,JohnDoeEnterprise,2019 Y,N,0.188,0.1,0.4,0.2,0.589,0.3\n'+
'-----\n'+
'\n\n\n'
>
];
assert: '[{"values":[123456,"DUMMYCOMPANY","JohnDoeEnterprise","2019 Y","N",188.0,400.0,589.0]}]';
)
]
)
There are two other Legend concepts that are very essential to a data model execution: connection and runtime.
A connection contains the physical database access methods like credentials, roles etc. This is what a connection looks like in Legend Studio:
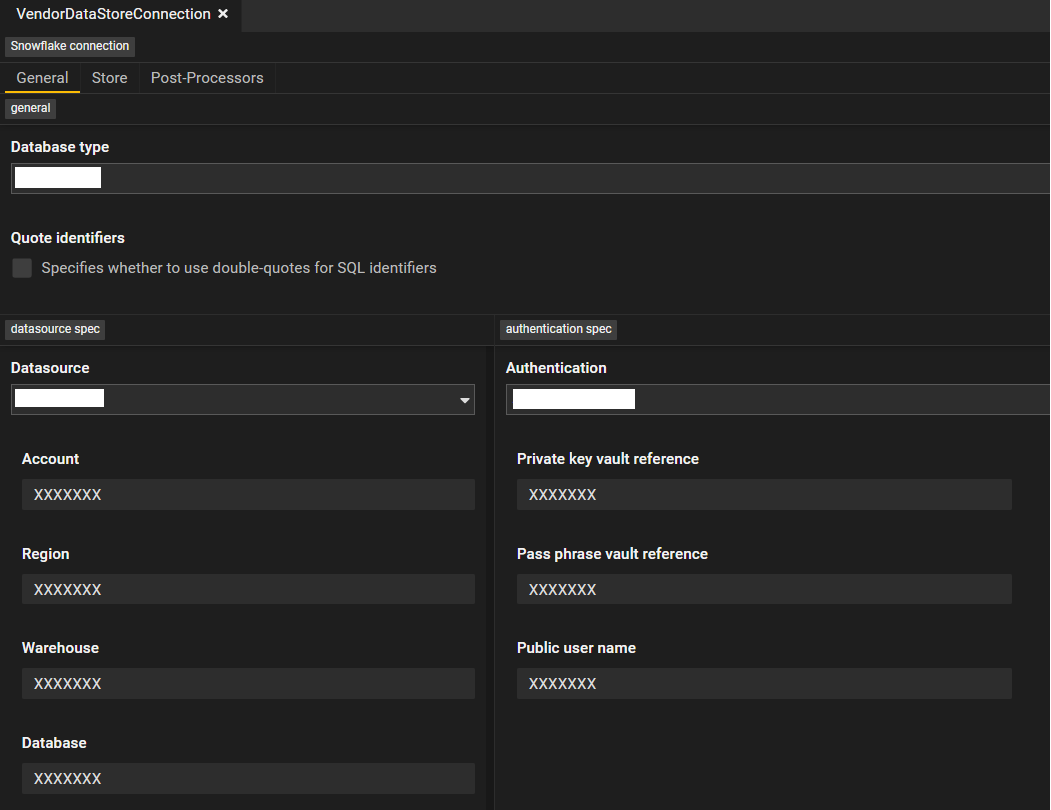
Programmatic Representation of Connection
Code ###Connection
RelationalDatabaseConnection runtime::connection::VendorDataStoreConnection
{
  store: Vendor::ESGStore;
  type: XXXXXXX;
  specification: XXXXXXXX
  {
    name: 'XXXXXXX';
    account: 'XXXXXXX';
    warehouse: 'XXXXXXX';
    region: 'XXXXXXX';
  };
  auth: Public
  {
    publicUserName: 'XXXXXXX';
    privateKeyVaultReference: 'XXXXXXX';
    passPhraseVaultReference: 'XXXXXXX';
  };
}
And a runtime links a connection to a database mapping, as seen below:
Programmatic Representation of Runtime
###Runtime
Runtime runtime::VendorESGRuntime
{
  mappings:
  [
    Vendor::ESG_Mapping
  ];
  connections:
  [
    Vendor::ESGStore:
    [
      connection_1: runtime::connection::VendorDataStoreConnection
    ]
  ];
}
Now that we have defined all the five necessary components in a basic Legend Model, users can access the logical class and view the data.
Relationships in Data Models
Another important feature to highlight is the ability to define associations and compositions, which is a JOIN between two entities.
This is illustrated in the below example where we traverse through Goldman Sachs Product Master to access additional vendor content using corresponding identifiers.
Let's assume the below reference data model is something like this:
Product Reference Class

Product Reference Mapping
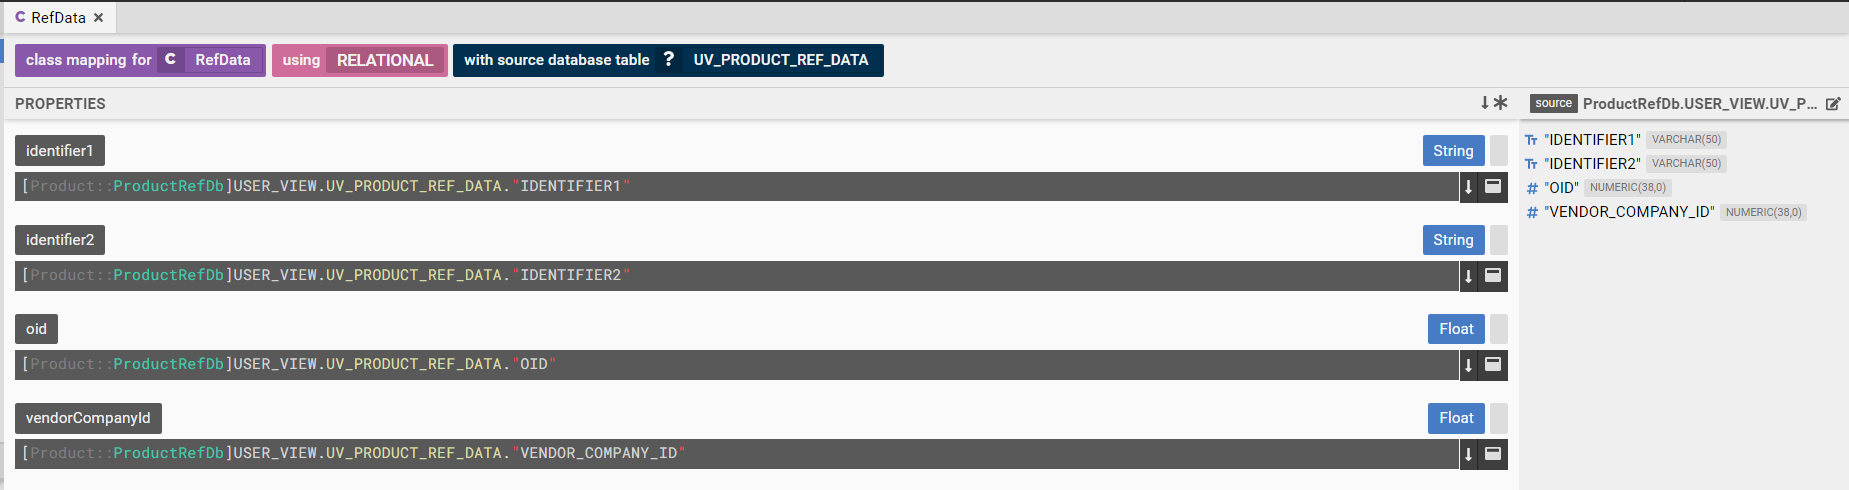
Programmatic Representation of Reference Data Model
###Relational
Database Product::ProductRefDb
(
  Schema USER_VIEW
  (
    Table UV_PRODUCT_REF_DATA
    (
      "OID" NUMERIC(38, 0) PRIMARY KEY,
      "VENDOR_COMPANY_ID" NUMERIC(38, 0),
      "IDENTIFIER1" VARCHAR(50),
      "IDENTIFIER2" VARCHAR(50)
    )
  )
)

###Pure
Class Product::RefData
{
  oid: Float[0..1];
  vendorCompanyId: Float[0..1];
  identifier1: String[0..1];
  identifier2: String[0..1];
}

###Mapping Mapping Product::RefData_Mapping
(
  Product::RefData: Relational
  {
    ~primaryKey
    (
      [Product::ProductRefDb]USER_VIEW.UV_PRODUCT_REF_DATA."OID"
    )
    ~mainTable [Product::ProductRefDb]USER_VIEW.UV_PRODUCT_REF_DATA
    oid: [Product::ProductRefDb]USER_VIEW.UV_PRODUCT_REF_DATA."OID",
    vendorCompanyId: [Product::ProductRefDb]USER_VIEW.UV_PRODUCT_REF_DATA."VENDOR_COMPANY_ID",
    identifier1: [Product::ProductRefDb]USER_VIEW.UV_PRODUCT_REF_DATA."IDENTIFIER1",
    identifier2: [Product::ProductRefDb]USER_VIEW.UV_PRODUCT_REF_DATA."IDENTIFIER2"
  }
In Legend, we can create relationships between these two distinct datasets which is called an association. An association is created when functionally it is a two way query. We should think of this in terms of how users will query the data, in this case, generally our internal users can start either from the ESG table and join with product to get some reference data OR start from reference data and get ESG attributes from the ESG table. So we define the association as:

Programmatic representation of association between Product Reference and ESG classes:
###Relational
//At the database level - we have to define the physical join conditions

Database Vendor::VendorProductCommonDb
(
  include Product::ProductRefDb
  include Vendor::ESGStore

  Join EsgToProduct(USER_VIEW.UV_PRODUCT_REF_DATA."VENDOR_COMPANY_ID" = USER_VIEW.ESG_EMISSIONS_HISTORY."COMPANY_ID")
)

###Pure
//Logically we have to define the relationship and cardinality

Association Vendor::EsgToProduct
{
  Esg: Vendor::EsgEmissionsHistory[0..1];
  refData: Product::RefData[1];
}

//This defines the mapping between the logical relationship and the physical Join conditions
//Generally it is a good practice to create association mappings at a common covering mapping
###Mapping
Mapping Vendor::VendorProductCommonMapping
(
  include Product::Product_Mapping
  include Vendor::ESG_Mapping

  Vendor::EsgToProduct: Relational
  {
    AssociationMapping
    (
      Esg[Product_RefData,Vendor_EsgEmissionsHistory]: [Vendor::VendorProductCommonDb]@EsgToProduct,
      refData[Vendor_EsgEmissionsHistory,Product_RefData]: [Vendor::VendorProductCommonDb]@EsgToProduct
    )
  }
)
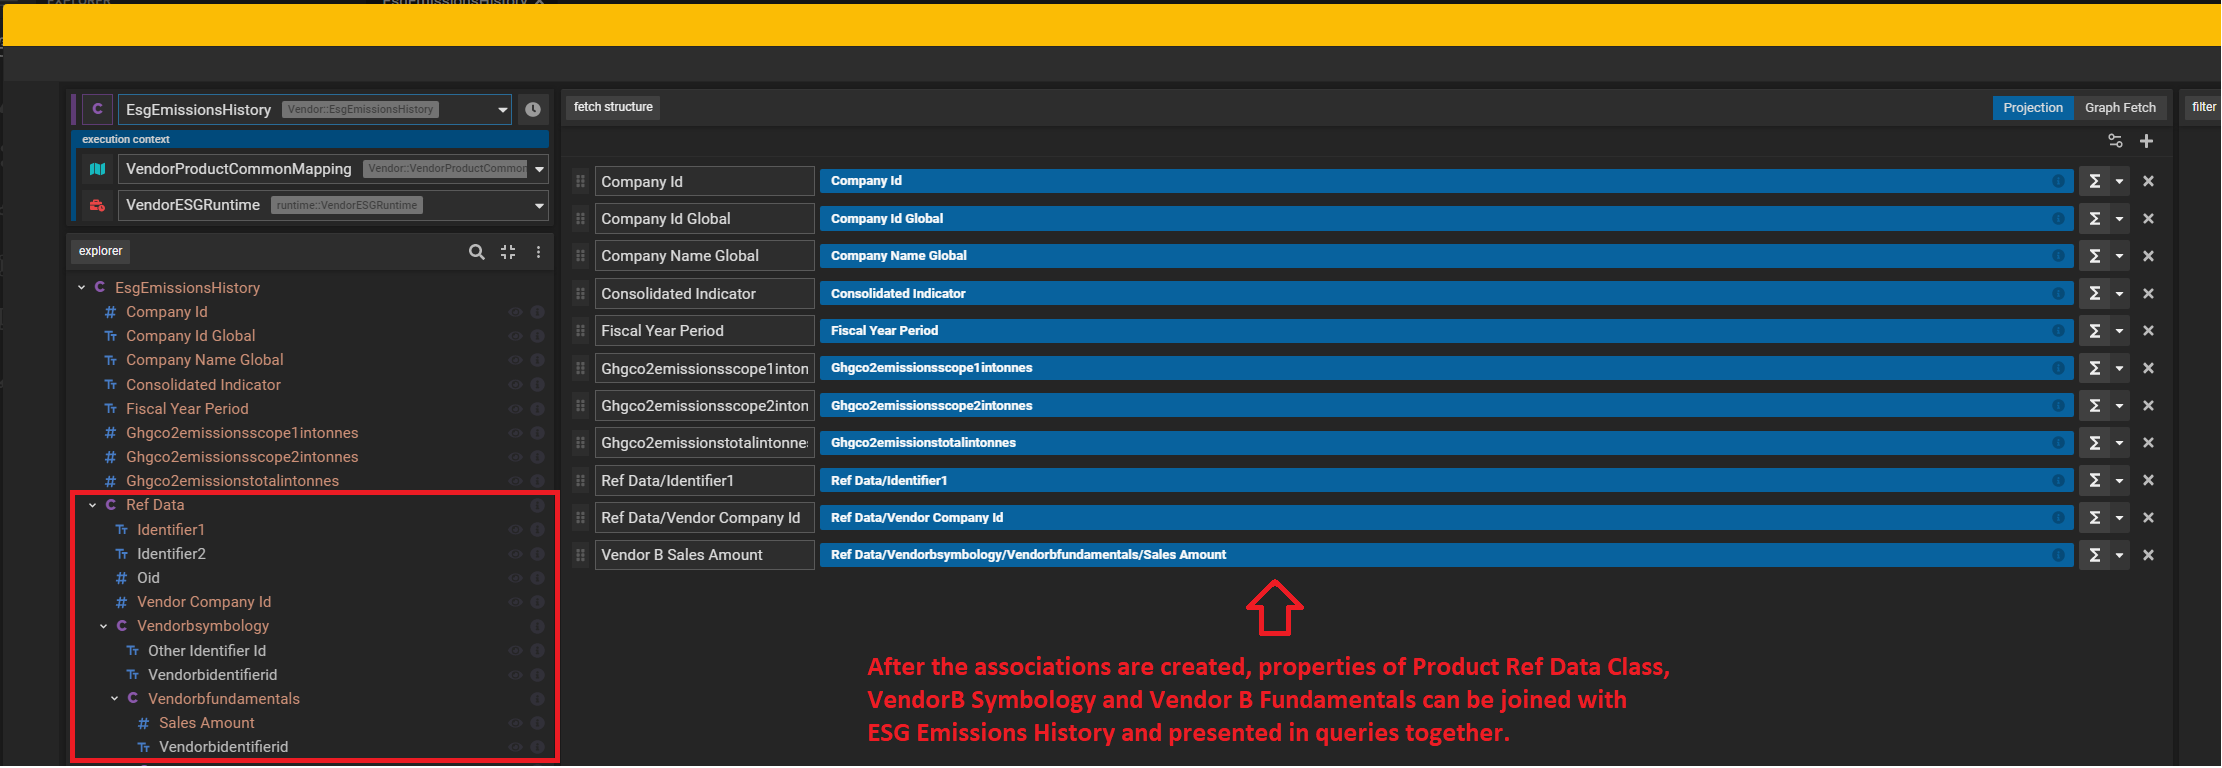
And the above process can be repeated and used for multiple joins across multiple datasets in a cascading way. To give an example - assuming a Vendor "B" who supplies Fundamentals data, it can be joined to Reference Data, and ultimately to Esg Emissions in a very similar way. Legend Studio has a feature called Diagram which helps us visualize these relationships better.
Esg Emissions History → Product Ref Data → Vendor "B" Symbology → Vendor "B" Fundamentals
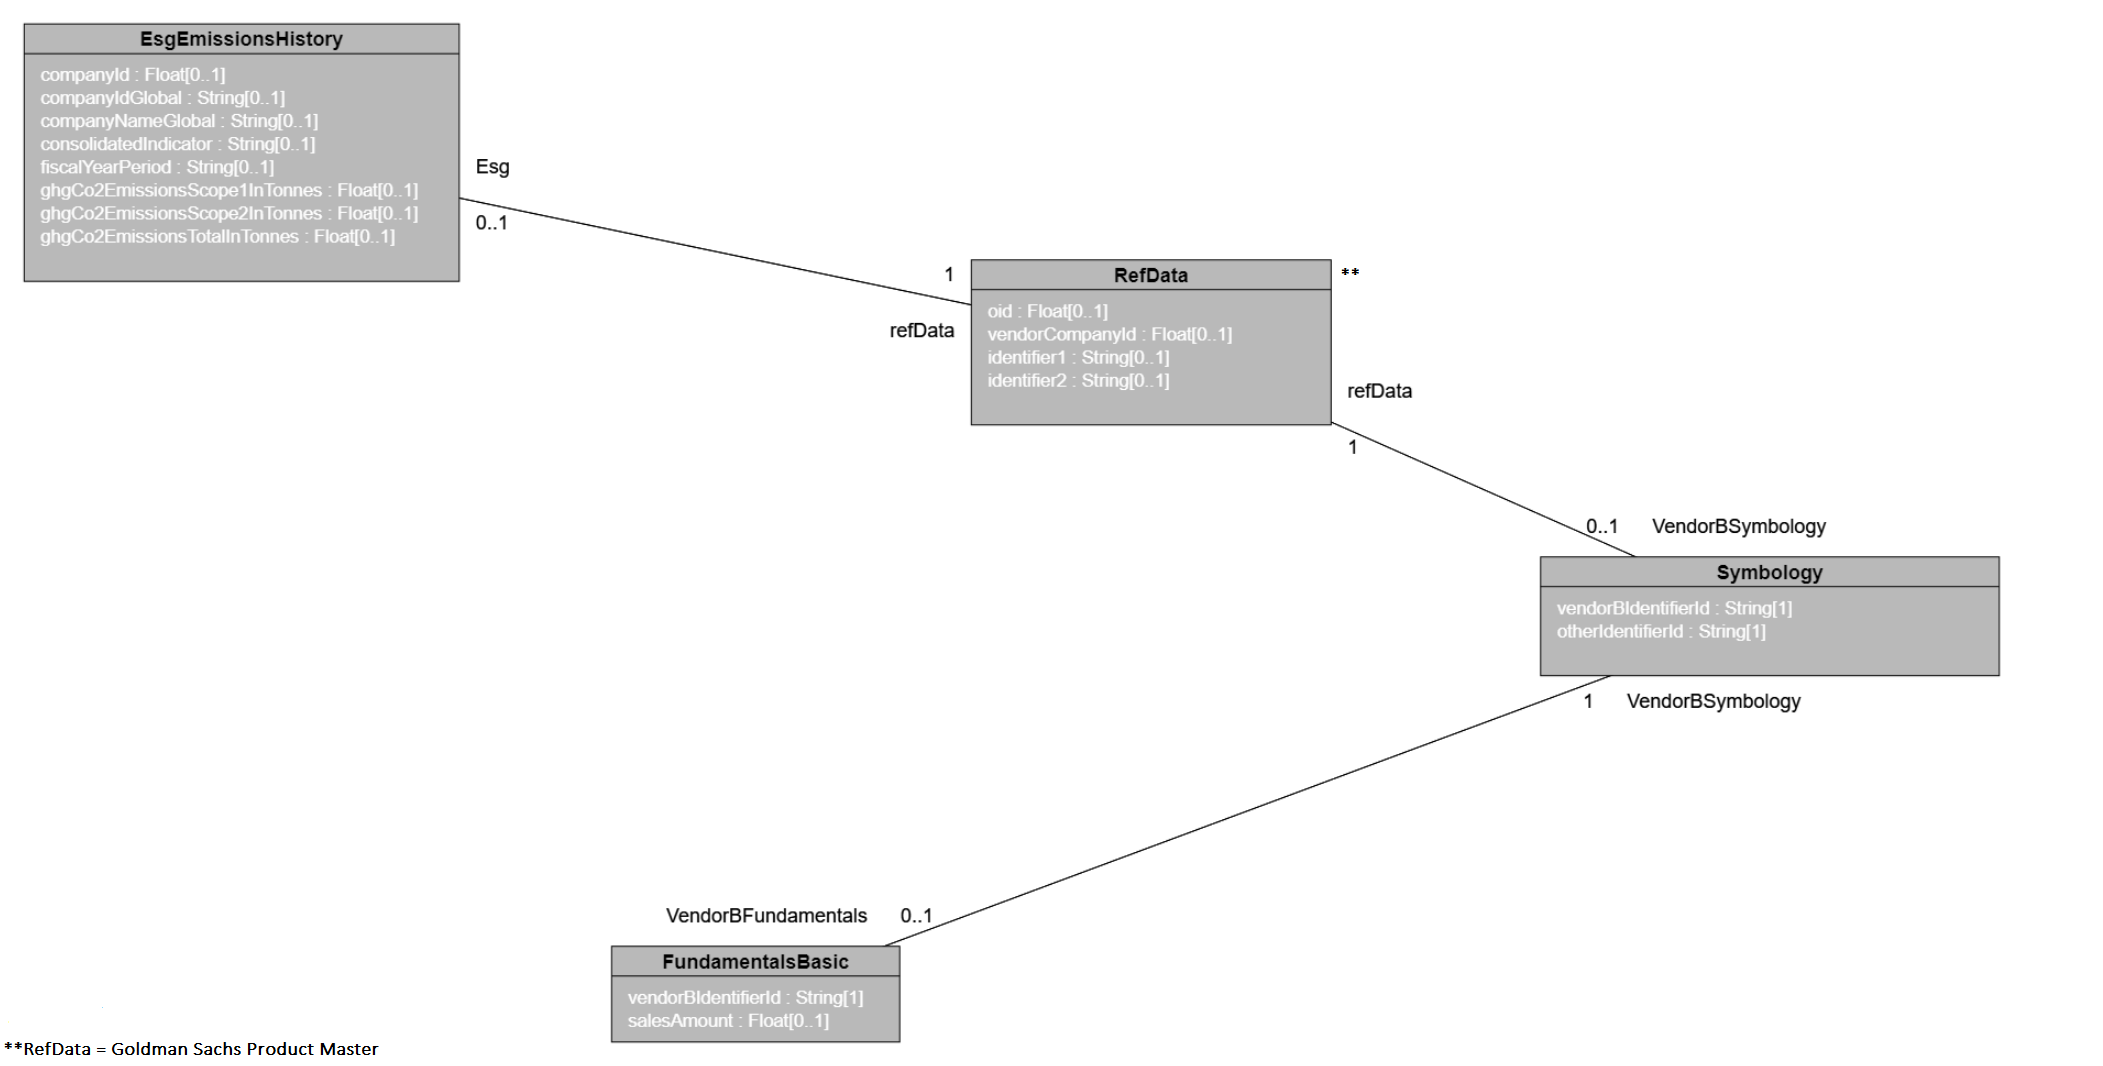
Programmatic representation of ESG Emissions and Fundamentals data across different vendors:
###Relational
Database Vendor::VendorProductCommonDb(
........
........
// This is the common physical schema or Pure Store where all the joins will be defined
Join ProductToVendorBSymbology(USER_VIEW.UV_PRODUCT_REF_DATA."IDENTIFIER1" = USER_VIEW.VENDORB_SYMBOLOGY."OTHER_IDENTIFIERID") //Join from product reference data to Vendor B Symbology
Join VendorBSymbologytoVendorBFundamentals(USER_VIEW.VENDORB_SYMBOLOGY."VENDORB_IDENTIFIERID" = USER_VIEW.VENDORB_FUNDAMENTALS_BASIC."VENDORB_IDENTIFIERID") //Join from Vendor B Symbology to Vendor B Fundamentals
.......
......
)


###Pure
Association VendorB::ProductToVendorBSymbology
{
  refData: Product::RefData[1];
  VendorBSymbology: VendorB::Symbology[0..1];
}

Association VendorB::VendorBSymbologyToVendorBFundamentalsBasic
{
  VendorBSymbology: VendorB::Symbology[1];
  VendorBFundamentals: VendorB::FundamentalsBasic[0..1];
}

###Mapping
Mapping Vendor::VendorProductCommonMapping(
......
......
VendorB::ProductToVendorBSymbology: Relational
  {
    AssociationMapping
    (
      refData[VendorB_Symbology,Product_RefData]: [Vendor::VendorProductCommonDb]@ProductToVendorBSymbology,
      VendorBSymbology[Product_RefData,VendorB_Symbology]: [Vendor::VendorProductCommonDb]@ProductToVendorBSymbology
    )
  }
  VendorB::VendorBSymbologyToVendorBFundamentalsBasic: Relational
  {
    AssociationMapping
    (
      VendorBSymbology[VendorB_FundamentalsBasic,VendorB_Symbology]: [Vendor::VendorProductCommonDb]@VendorBSymbologytoVendorBFundamentals,
      VendorBFundamentals[VendorB_Symbology,VendorB_FundamentalsBasic]: [Vendor::VendorProductCommonDb]@VendorBSymbologytoVendorBFundamentals
    )
  }
.......
.......
//Legend also allows a more concise way of chaining multiple joins in a single mapping as well. In that case the Association mapping section would look something like below

Vendor::EsgEmissionsHistoryToVendorBFundamentalsBasic: Relational
  {
    AssociationMapping
    (
      EsgEmissionsHistory[VendorB_FundamentalsBasic,Vendor_EsgEmissionsHistory]: [Vendor::VendorProductCommonDb]@VendorBSymbologytoVendorBFundamentals > [Vendor::VendorProductCommonDb]@ProductToVendorBSymbology > [Vendor::VendorProductCommonDb]@EsgToProduct,
      VendorBFundamentalsBasic[Vendor_EsgEmissionsHistory,VendorB_FundamentalsBasic]: [Vendor::VendorProductCommonDb]@EsgToProduct > [Vendor::VendorProductCommonDb]@ProductToVendorBSymbology > [Vendor::VendorProductCommonDb]@VendorBSymbologytoVendorBFundamentals
    )
}
Once the relationships have been established users are able to directly scribble queries with attributes from different data models and put their own functions and logic to serve data as the business needs.
Data Consumption
There are several options to tackle data consumption: a GUI based query tool called Legend Query which allows all basic functionalities like filter and aggregations, a simple drag and drop interface which lets you select attributes, apply logic like group by, sort or custom functions and present data in a tabular format
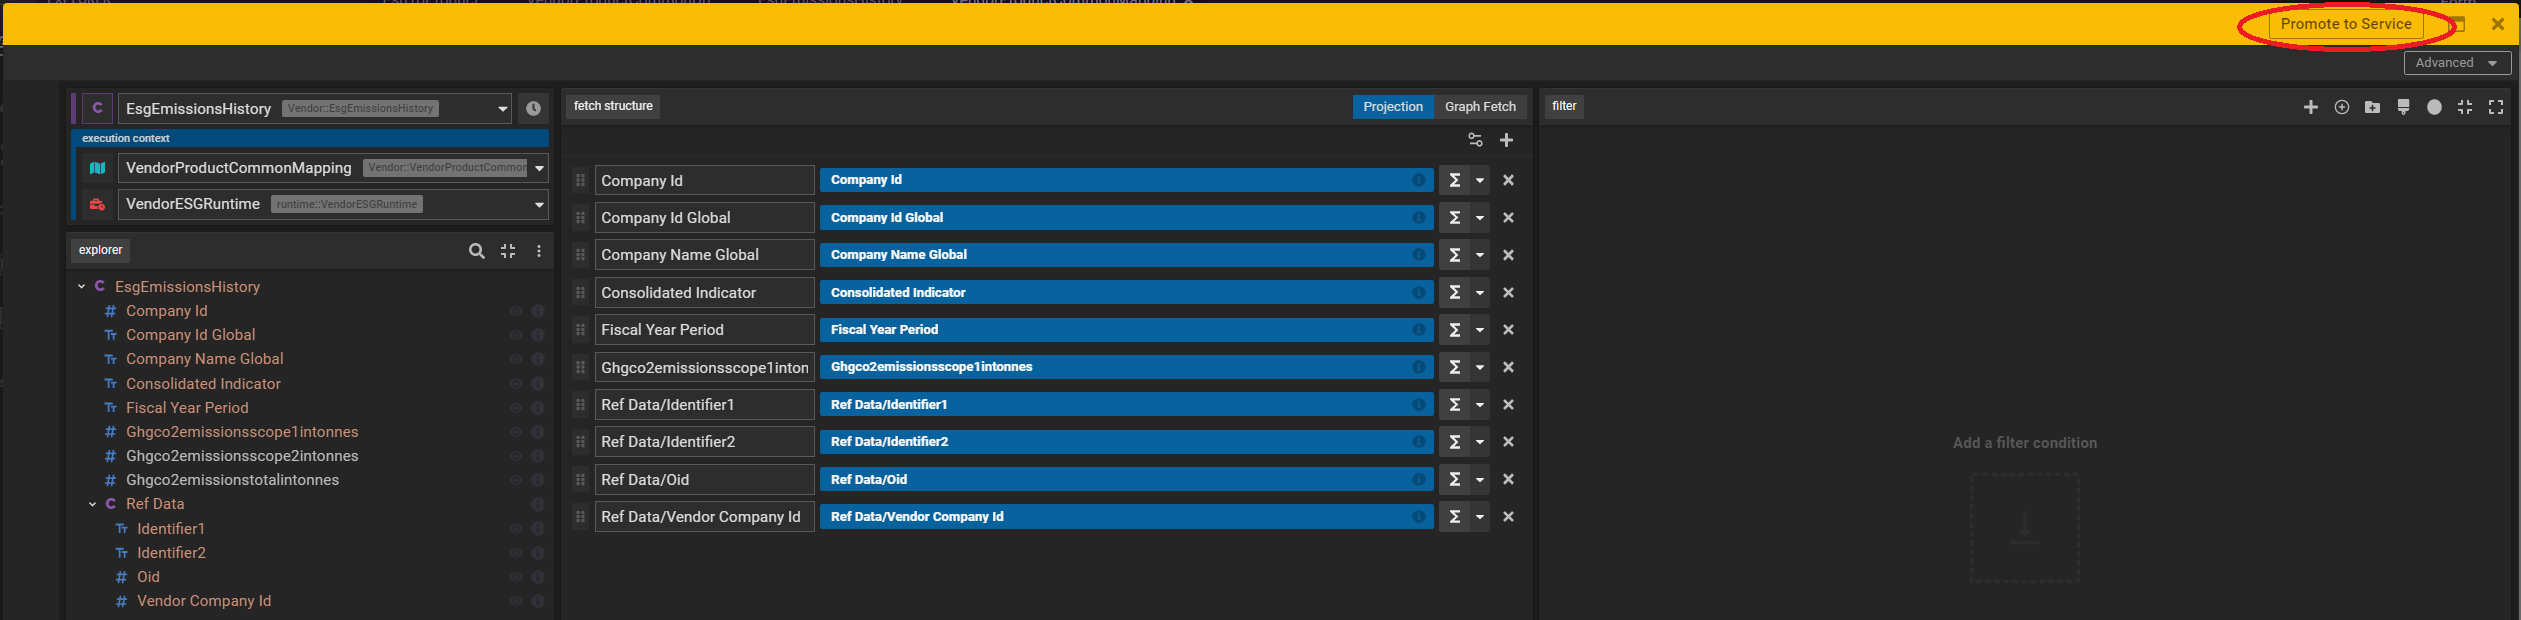
The Legend Query is a great way for researchers to run exploratory analysis on the data. Once they are satisfied with the shape, taxonomy and data quality and ready to productionize the consumption with the click of a button (highlighted in the above screenshot) they can promote it to a packaged service which can be accessed via a REST endpoint and consumed by various applications.
A Legend service looks like this:


Programmatic Representation of a Legend Service
###Service
Service Vendor::ESG_Service
{
  pattern: '/getVendorESGData/{fiscalYearPeriod}';
  owners:
  [
    'owner1',
    'owner2'
  ];
  documentation: 'Test ESG Service for providing consolidated ESG data filtered by Fiscal Year';
  autoActivateUpdates: true;
  execution: Single
  {
    query: fiscalYearPeriod: String[1]|Vendor::EsgEmissionsHistory.all()->filter(x|$x.fiscalYearPeriod == $fiscalYearPeriod)->project([x|$x.companyId, x|$x.companyIdGlobal, x|$x.companyNameGlobal, x|$x.consolidatedIndicator, x|$x.fiscalYearPeriod, x|$x.ghgCo2EmissionsScope1InTonnes, x|$x.ghgCo2EmissionsScope2InTonnes, x|$x.ghgCo2EmissionsTotalInTonnes], ['Company Id', 'Company Id Global', 'Company Name Global', 'Consolidated Indicator', 'Fiscal Year Period', 'Ghgco2emissionsscope1intonnes', 'Ghgco2emissionsscope2intonnes', 'Ghgco2emissionstotalintonnes']);
    mapping: Vendor::ESG_Mapping;
    runtime: runtime::VendorESGRuntime;
  }
}
When the above Legend service is registered against an execution environment, it can be called from several clients such as Java and Python applications as well as connectors to analytical tools including Tableau and Microsoft Excel.
The Marquee Carbon Analytics tool uses Legend Service APIs before exposing the data through its external UI. With the power of the cloud-based GS Vendor Data Store and Legend Data Platform, ESG analysts have fast and flexible access to modelled Vendor Data completely governed by Goldman Sachs Engineering.
Conclusion
It's an exciting time in sustainability and we have come far in achieving our goals to accelerate climate transition and advance inclusive growth. Building on 20 years of experience in sustainable finance, Goldman Sachs is making significant progress on its commitments towards a more sustainable future. Leveraging ESG data is crucial to achieve a number of those commitments. As showcased in these examples, ESG Beacon and data engineering play a key role in driving forward Goldman Sachs’ efforts to efficiently ingest and use ESG data, further advancing our ESG data strategy.
As we mark the two year anniversary of our sustainability commitment announcement, the need to unlock further understanding of ESG data only becomes more apparent. Goldman Sachs continues to invest in engineering capabilities to reach the goal, including our financial cloud initiatives.
Source: Goldman Sachs 2021 Sustainability Report
---
Does the desire to accelerate climate transition and advance inclusive growth resonate with you and would you like to be part of the Goldman Sachs Engineering capabilities fueling this vision? Join us and explore our careers page to learn more.
See https://www.gs.com/disclaimer/global_email for important risk disclosures, conflicts of interest, and other terms and conditions relating to this blog and your reliance on information contained in it.
Solutions
Curated Data Security MasterData AnalyticsPlotTool ProPortfolio AnalyticsGS QuantTransaction BankingGS DAP®Liquidity Investing¹ Real-time data can be impacted by planned system maintenance, connectivity or availability issues stemming from related third-party service providers, or other intermittent or unplanned technology issues.
Transaction Banking services are offered by Goldman Sachs Bank USA ("GS Bank") and its affiliates. GS Bank is a New York State chartered bank, a member of the Federal Reserve System and a Member FDIC. For additional information, please see Bank Regulatory Information.
² Source: Goldman Sachs Asset Management, as of March 31, 2025.
Mosaic is a service mark of Goldman Sachs & Co. LLC. This service is made available in the United States by Goldman Sachs & Co. LLC and outside of the United States by Goldman Sachs International, or its local affiliates in accordance with applicable law and regulations. Goldman Sachs International and Goldman Sachs & Co. LLC are the distributors of the Goldman Sachs Funds. Depending upon the jurisdiction in which you are located, transactions in non-Goldman Sachs money market funds are affected by either Goldman Sachs & Co. LLC, a member of FINRA, SIPC and NYSE, or Goldman Sachs International. For additional information contact your Goldman Sachs representative. Goldman Sachs & Co. LLC, Goldman Sachs International, Goldman Sachs Liquidity Solutions, Goldman Sachs Asset Management, L.P., and the Goldman Sachs funds available through Goldman Sachs Liquidity Solutions and other affiliated entities, are under the common control of the Goldman Sachs Group, Inc.
Goldman Sachs & Co. LLC is a registered U.S. broker-dealer and futures commission merchant, and is subject to regulatory capital requirements including those imposed by the SEC, the U.S. Commodity Futures Trading Commission (CFTC), the Chicago Mercantile Exchange, the Financial Industry Regulatory Authority, Inc. and the National Futures Association.
FOR INSTITUTIONAL USE ONLY - NOT FOR USE AND/OR DISTRIBUTION TO RETAIL AND THE GENERAL PUBLIC.
This material is for informational purposes only. It is not an offer or solicitation to buy or sell any securities.
THIS MATERIAL DOES NOT CONSTITUTE AN OFFER OR SOLICITATION IN ANY JURISDICTION WHERE OR TO ANY PERSON TO WHOM IT WOULD BE UNAUTHORIZED OR UNLAWFUL TO DO SO. Prospective investors should inform themselves as to any applicable legal requirements and taxation and exchange control regulations in the countries of their citizenship, residence or domicile which might be relevant. This material is provided for informational purposes only and should not be construed as investment advice or an offer or solicitation to buy or sell securities. This material is not intended to be used as a general guide to investing, or as a source of any specific investment recommendations, and makes no implied or express recommendations concerning the manner in which any client's account should or would be handled, as appropriate investment strategies depend upon the client's investment objectives.
United Kingdom: In the United Kingdom, this material is a financial promotion and has been approved by Goldman Sachs Asset Management International, which is authorized and regulated in the United Kingdom by the Financial Conduct Authority.
European Economic Area (EEA): This marketing communication is disseminated by Goldman Sachs Asset Management B.V., including through its branches ("GSAM BV"). GSAM BV is authorised and regulated by the Dutch Authority for the Financial Markets (Autoriteit Financiële Markten, Vijzelgracht 50, 1017 HS Amsterdam, The Netherlands) as an alternative investment fund manager ("AIFM") as well as a manager of undertakings for collective investment in transferable securities ("UCITS"). Under its licence as an AIFM, the Manager is authorized to provide the investment services of (i) reception and transmission of orders in financial instruments; (ii) portfolio management; and (iii) investment advice. Under its licence as a manager of UCITS, the Manager is authorized to provide the investment services of (i) portfolio management; and (ii) investment advice.
Information about investor rights and collective redress mechanisms are available on www.gsam.com/responsible-investing (section Policies & Governance). Capital is at risk. Any claims arising out of or in connection with the terms and conditions of this disclaimer are governed by Dutch law.
To the extent it relates to custody activities, this financial promotion is disseminated by Goldman Sachs Bank Europe SE ("GSBE"), including through its authorised branches. GSBE is a credit institution incorporated in Germany and, within the Single Supervisory Mechanism established between those Member States of the European Union whose official currency is the Euro, subject to direct prudential supervision by the European Central Bank (Sonnemannstrasse 20, 60314 Frankfurt am Main, Germany) and in other respects supervised by German Federal Financial Supervisory Authority (Bundesanstalt für Finanzdienstleistungsaufsicht, BaFin) (Graurheindorfer Straße 108, 53117 Bonn, Germany; website: www.bafin.de) and Deutsche Bundesbank (Hauptverwaltung Frankfurt, Taunusanlage 5, 60329 Frankfurt am Main, Germany).
Switzerland: For Qualified Investor use only - Not for distribution to general public. This is marketing material. This document is provided to you by Goldman Sachs Bank AG, Zürich. Any future contractual relationships will be entered into with affiliates of Goldman Sachs Bank AG, which are domiciled outside of Switzerland. We would like to remind you that foreign (Non-Swiss) legal and regulatory systems may not provide the same level of protection in relation to client confidentiality and data protection as offered to you by Swiss law.
Asia excluding Japan: Please note that neither Goldman Sachs Asset Management (Hong Kong) Limited ("GSAMHK") or Goldman Sachs Asset Management (Singapore) Pte. Ltd. (Company Number: 201329851H ) ("GSAMS") nor any other entities involved in the Goldman Sachs Asset Management business that provide this material and information maintain any licenses, authorizations or registrations in Asia (other than Japan), except that it conducts businesses (subject to applicable local regulations) in and from the following jurisdictions: Hong Kong, Singapore, India and China. This material has been issued for use in or from Hong Kong by Goldman Sachs Asset Management (Hong Kong) Limited and in or from Singapore by Goldman Sachs Asset Management (Singapore) Pte. Ltd. (Company Number: 201329851H).
Australia: This material is distributed by Goldman Sachs Asset Management Australia Pty Ltd ABN 41 006 099 681, AFSL 228948 (‘GSAMA’) and is intended for viewing only by wholesale clients for the purposes of section 761G of the Corporations Act 2001 (Cth). This document may not be distributed to retail clients in Australia (as that term is defined in the Corporations Act 2001 (Cth)) or to the general public. This document may not be reproduced or distributed to any person without the prior consent of GSAMA. To the extent that this document contains any statement which may be considered to be financial product advice in Australia under the Corporations Act 2001 (Cth), that advice is intended to be given to the intended recipient of this document only, being a wholesale client for the purposes of the Corporations Act 2001 (Cth). Any advice provided in this document is provided by either of the following entities. They are exempt from the requirement to hold an Australian financial services licence under the Corporations Act of Australia and therefore do not hold any Australian Financial Services Licences, and are regulated under their respective laws applicable to their jurisdictions, which differ from Australian laws. Any financial services given to any person by these entities by distributing this document in Australia are provided to such persons pursuant to the respective ASIC Class Orders and ASIC Instrument mentioned below.
- Goldman Sachs Asset Management, LP (GSAMLP), Goldman Sachs & Co. LLC (GSCo), pursuant ASIC Class Order 03/1100; regulated by the US Securities and Exchange Commission under US laws.
- Goldman Sachs Asset Management International (GSAMI), Goldman Sachs International (GSI), pursuant to ASIC Class Order 03/1099; regulated by the Financial Conduct Authority; GSI is also authorized by the Prudential Regulation Authority, and both entities are under UK laws.
- Goldman Sachs Asset Management (Singapore) Pte. Ltd. (GSAMS), pursuant to ASIC Class Order 03/1102; regulated by the Monetary Authority of Singapore under Singaporean laws
- Goldman Sachs Asset Management (Hong Kong) Limited (GSAMHK), pursuant to ASIC Class Order 03/1103 and Goldman Sachs (Asia) LLC (GSALLC), pursuant to ASIC Instrument 04/0250; regulated by the Securities and Futures Commission of Hong Kong under Hong Kong laws
No offer to acquire any interest in a fund or a financial product is being made to you in this document. If the interests or financial products do become available in the future, the offer may be arranged by GSAMA in accordance with section 911A(2)(b) of the Corporations Act. GSAMA holds Australian Financial Services Licence No. 228948. Any offer will only be made in circumstances where disclosure is not required under Part 6D.2 of the Corporations Act or a product disclosure statement is not required to be given under Part 7.9 of the Corporations Act (as relevant).
FOR DISTRIBUTION ONLY TO FINANCIAL INSTITUTIONS, FINANCIAL SERVICES LICENSEES AND THEIR ADVISERS. NOT FOR VIEWING BY RETAIL CLIENTS OR MEMBERS OF THE GENERAL PUBLIC
Canada: This presentation has been communicated in Canada by GSAM LP, which is registered as a portfolio manager under securities legislation in all provinces of Canada and as a commodity trading manager under the commodity futures legislation of Ontario and as a derivatives adviser under the derivatives legislation of Quebec. GSAM LP is not registered to provide investment advisory or portfolio management services in respect of exchange-traded futures or options contracts in Manitoba and is not offering to provide such investment advisory or portfolio management services in Manitoba by delivery of this material.
Japan: This material has been issued or approved in Japan for the use of professional investors defined in Article 2 paragraph (31) of the Financial Instruments and Exchange Law ("FIEL"). Also, any description regarding investment strategies on or funds as collective investment scheme under Article 2 paragraph (2) item 5 or item 6 of FIEL has been approved only for Qualified Institutional Investors defined in Article 10 of Cabinet Office Ordinance of Definitions under Article 2 of FIEL.
Interest Rate Benchmark Transition Risks: This transaction may require payments or calculations to be made by reference to a benchmark rate ("Benchmark"), which will likely soon stop being published and be replaced by an alternative rate, or will be subject to substantial reform. These changes could have unpredictable and material consequences to the value, price, cost and/or performance of this transaction in the future and create material economic mismatches if you are using this transaction for hedging or similar purposes. Goldman Sachs may also have rights to exercise discretion to determine a replacement rate for the Benchmark for this transaction, including any price or other adjustments to account for differences between the replacement rate and the Benchmark, and the replacement rate and any adjustments we select may be inconsistent with, or contrary to, your interests or positions. Other material risks related to Benchmark reform can be found at https://www.gs.com/interest-rate-benchmark-transition-notice. Goldman Sachs cannot provide any assurances as to the materialization, consequences, or likely costs or expenses associated with any of the changes or risks arising from Benchmark reform, though they may be material. You are encouraged to seek independent legal, financial, tax, accounting, regulatory, or other appropriate advice on how changes to the Benchmark could impact this transaction.
Confidentiality: No part of this material may, without GSAM's prior written consent, be (i) copied, photocopied or duplicated in any form, by any means, or (ii) distributed to any person that is not an employee, officer, director, or authorized agent of the recipient.
GSAM Services Private Limited (formerly Goldman Sachs Asset Management (India) Private Limited) acts as the Investment Advisor, providing non-binding non-discretionary investment advice to dedicated offshore mandates, involving Indian and overseas securities, managed by GSAM entities based outside India. Members of the India team do not participate in the investment decision making process.