Data
Overview
GS Quant DataGrid class allows users to create simple and complex grids based on data in the Marquee Platform and pass the data through processors (functions). DataGrid is entirely built on Pandas for performance and its abundant features. Data fetching is built on our Data Coordinate and Entity models for ease of use and customizability. All our processors have a defined model eliminating any of the guess-work on how to fetch and process the required series.
The DataGrid interface allows grids to be displayed and shared on Marquee. In conjunction with our Marquee Markets platform, dashboards with DataGrids and other components can be built.
Create a DataGrid
Simply put, DataGrids are defined as a set of rows and columns. A row represents an Entity that is automatically applied across columns. A column specifies what data is fetched and which processors are applied on the data.
Terminology
To get you started, here is some terminology used across our DataGrid documentation and examples.
| Term | Description |
|---|---|
| DataRow | A DataRow is a row in the grid. Rows are defined with an Entity but may have also have coordinate overrides such as different tenors on an implied volatility coordinate. |
| DataColumn | DataColumns define columns of DataGrid. This includes the name of the column, data to be fetched, and processors applied on the data. |
| Processor | A Processor is a function applied on a Pandas Series or Entity. |
Creating your First DataGrid
Note
The below snippets require an initialized GsSession. Please refer to Sessions for details.
To create a DataGrid, there are three simple steps:
Define Rows
from gs_quant.analytics.datagrid import DataRow
from gs_quant.markets.securities import Asset, AssetIdentifier

GS = Asset.get("GS UN", AssetIdentifier.BLOOMBERG_ID)
AAPL = Asset.get("AAPL UW", AssetIdentifier.BLOOMBERG_ID)
AMZN = Asset.get("AMZN UW", AssetIdentifier.BLOOMBERG_ID)

rows = [DataRow(GS), DataRow(AAPL), DataRow(AMZN)]
We first fetch our entites, in this case being GS, AAPL, and AMZN assets. We then build a list of DataRows for each asset.
Tip
Learn more about what entities are supported and how to fetch them here.
Define Columns
from gs_quant.analytics.datagrid import DataColumn
from gs_quant.analytics.processors import LastProcessor, EntityProcessor
from gs_quant.data.coordinate import DataCoordinate, DataMeasure, DataFrequency

trade_price = DataCoordinate(measure=DataMeasure.TRADE_PRICE, frequency=DataFrequency.REAL_TIME)

col_0 = DataColumn(name="Name", processor=EntityProcessor(field="short_name"))
col_1 = DataColumn(name="Last", processor=LastProcessor(trade_price))

columns = [col_0, col_1]
Let us go over the above snippet. We first declared the trade_price coordinate which represents real-time trade prices. We then built our DataColumns:
- col_0: Specifies a column with a column name of "Name" and applies an EntityProcessor. This processor gets data about the underlying entity, such as an indentifier or the entity name. In this case, the short_name of the asset.
- col_1: Specifies the "Last" column and applies the LastProcessor on the
trade_pricecoordinate. This means the column will fetch thetrade_pricecoordinate and then apply the LastProcessor which simply gets the last of value the coordinate series. Ultimately, this column will show the last trade price of the entity associated on the row.
Instantiate the DataGrid
Once you have built your rows and columns, you are now ready to build your DataGrid!
from gs_quant.analytics.datagrid import DataGrid
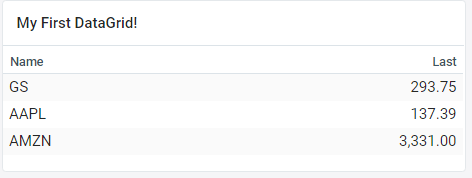
datagrid = DataGrid(name="My First DataGrid!", rows=rows, columns=columns)Once the DataGrid object is instantiated you can call instantiate, poll, and to_frame.
datagrid.initialize()
datagrid.poll()
print(datagrid.to_frame())
This outputs a DataFrame which looks like:
   Name     Last
0    GS   281.76
1  AAPL   143.16
2  AMZN  3326.13
Here's a little background on the above methods.
| Method | Description |
|---|---|
| initialize | Generates dependency graph for each cell in the grid. The graph depends on all required data from the coordinates and and processors applied on the data for each cell. |
| poll | Polls uses this graph to fetch all required data and applies the processors in the grid in the correct order. |
| to_frame | Puts the results of each cell into a Pandas DataFrame for further manual processing or output. Any specified post-processing such as filters and sorts also happen during this method. |
Creating a More Complex DataGrid
Let us use the exact same rows as above but add some addional columns.
Using Relative Dates
from gs_quant.analytics.processors import VolatilityProcessor
col_2 = DataColumn(name="YTD Volatility",
processor=VolatilityProcessor(close, start=RelativeDate('A')))
columns = [col_0, col_1, col_2]
datagrid = DataGrid('RelativeDate DataGrid', rows=rows, columns=columns)
datagrid.initialize(), datagrid.poll()
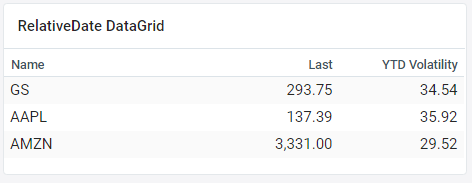
print(datagrid.to_frame())This outputs a DataFrame which looks like:
   Name     Last  YTD Volatility
0    GS   274.87       34.754976
1  AAPL   133.07       36.125516
2 AMZN 3215.27 27.730805col_2: Specifies a column with a column name of "YTD Volatility" and applies a VolatilityProcessor. This processor applies the volatillity timeseries function across a year of the entities' close prices. As you can see, a RelativeDate object was used to specify the start of the current year. You can read more about using RelativeDates.
Nesting Processors
Let us now replace col_2 with an advanced nested processor.
from gs_quant.analytics.processors import AppendProcessor
col_2 = DataColumn(name="1d Chg (RT)",
processor=ChangeProcessor(
AppendProcessor(close, LastProcessor(trade_price), start=RelativeDate('-1d'),
end=RelativeDate('-1d'))))
columns = [col_0, col_1, col_2]
datagrid = DataGrid('Nested Processor DataGrid', rows=rows, columns=columns)
datagrid.initialize(), datagrid.poll()
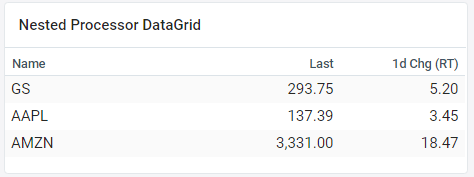
print(datagrid.to_frame())This outputs a DataFrame which looks like:
   Name     Last  1d Chg (RT)
0    GS   271.21        -3.81
1  AAPL   132.33        -4.76
2 AMZN 3207.49 -30.13col_2: Specifies a column with a column name of "1d Chg (RT)" and applies the ChangeProcessor on a the previous close price and the appended real-time trade price. Ultimately, this column gets the change in price from yesterday and today's real-time price.
Full Examples
Below are all the examples from above in single code snippets. Feel free to copy and paste them to try them out on your own! An image of the persisted DataGrids on the Marquee Markets platform is also shown. Learn more about how to create these in the Persistence and Visualization tutorials.
Your First DataGrid
from gs_quant.analytics.datagrid import DataColumn, DataRow, DataGrid
from gs_quant.analytics.processors import LastProcessor, EntityProcessor
from gs_quant.data.coordinate import DataCoordinate, DataMeasure, DataFrequency
from gs_quant.markets.securities import Asset, AssetIdentifier
from gs_quant.session import GsSession

GsSession.use()

GS = Asset.get("GS UN", AssetIdentifier.BLOOMBERG_ID)
AAPL = Asset.get("AAPL UW", AssetIdentifier.BLOOMBERG_ID)
AMZN = Asset.get("AMZN UW", AssetIdentifier.BLOOMBERG_ID)

rows = [DataRow(GS), DataRow(AAPL), DataRow(AMZN)]

trade_price = DataCoordinate(measure=DataMeasure.TRADE_PRICE, frequency=DataFrequency.REAL_TIME)

col_0 = DataColumn(name="Name", processor=EntityProcessor(field="short_name"))
col_1 = DataColumn(name="Last", processor=LastProcessor(trade_price))

columns = [col_0, col_1]

datagrid = DataGrid('My First DataGrid!', rows=rows, columns=columns)

datagrid.initialize()
datagrid.poll()
print(datagrid.to_frame())
Name Last
0 GS 281.76
1 AAPL 143.16
2 AMZN 3326.13Simple Relative Date
from gs_quant.analytics.datagrid import DataColumn, DataRow, DataGrid
from gs_quant.analytics.processors import LastProcessor, EntityProcessor, VolatilityProcessor
from gs_quant.data.coordinate import DataCoordinate, DataMeasure, DataFrequency
from gs_quant.datetime.relative_date import RelativeDate
from gs_quant.markets.securities import Asset, AssetIdentifier
from gs_quant.session import GsSession

GsSession.use()

GS = Asset.get("GS UN", AssetIdentifier.BLOOMBERG_ID)
AAPL = Asset.get("AAPL UW", AssetIdentifier.BLOOMBERG_ID)
AMZN = Asset.get("AMZN UW", AssetIdentifier.BLOOMBERG_ID)

rows = [DataRow(GS), DataRow(AAPL), DataRow(AMZN)]

trade_price = DataCoordinate(measure=DataMeasure.TRADE_PRICE, frequency=DataFrequency.REAL_TIME)

close = DataCoordinate(measure=DataMeasure.CLOSE_PRICE, frequency=DataFrequency.DAILY)

col_0 = DataColumn(name="Name", processor=EntityProcessor(field="short_name"))
col_1 = DataColumn(name="Last", processor=LastProcessor(trade_price))
col_2 = DataColumn(name="YTD Volatility",
                   processor=VolatilityProcessor(close, start=RelativeDate('A')))

columns = [col_0, col_1, col_2]

datagrid = DataGrid('RelativeDate DataGrid', rows=rows, columns=columns)
datagrid.initialize(), datagrid.poll()
print(datagrid.to_frame())
Name Last YTD Volatility
0 GS 274.87 34.754976
1 AAPL 133.07 36.125516
2 AMZN 3215.27 27.730805Nesting Processors
from gs_quant.analytics.datagrid import DataColumn, DataRow, DataGrid
from gs_quant.analytics.processors import LastProcessor, EntityProcessor, ChangeProcessor, AppendProcessor
from gs_quant.data.coordinate import DataCoordinate, DataMeasure, DataFrequency
from gs_quant.datetime.relative_date import RelativeDate
from gs_quant.markets.securities import Asset, AssetIdentifier
from gs_quant.session import GsSession

GsSession.use()

GS = Asset.get("GS UN", AssetIdentifier.BLOOMBERG_ID)
AAPL = Asset.get("AAPL UW", AssetIdentifier.BLOOMBERG_ID)
AMZN = Asset.get("AMZN UW", AssetIdentifier.BLOOMBERG_ID)

rows = [DataRow(GS), DataRow(AAPL), DataRow(AMZN)]

close = DataCoordinate(measure=DataMeasure.CLOSE_PRICE, frequency=DataFrequency.DAILY)

trade_price = DataCoordinate(measure=DataMeasure.TRADE_PRICE, frequency=DataFrequency.REAL_TIME)

col_0 = DataColumn(name="Name", processor=EntityProcessor(field="short_name"))
col_1 = DataColumn(name="Last", processor=LastProcessor(trade_price))
col_2 = DataColumn(name="1d Chg (RT)",
                   processor=ChangeProcessor(
                       AppendProcessor(close, LastProcessor(trade_price), start=RelativeDate('-1d'),
                                       end=RelativeDate('-1d'))))

columns = [col_0, col_1, col_2]

datagrid = DataGrid('Nested Processor DataGrid', rows=rows, columns=columns)

datagrid.initialize(), datagrid.poll()
print(datagrid.to_frame())
Name Last 1d Chg (RT)
0 GS 271.21 -3.81
1 AAPL 132.33 -4.76
2 AMZN 3207.49 -30.13Questions?
Please contact us at gs-marquee-markets@gs.com with any questions or feedback.
Related Content
DataCoordinates
arrow_forwardEntities
arrow_forwardRelativeDates
arrow_forwardDataGrid Processors
arrow_forwardDataGrid Persistence
arrow_forwardDataGrid Visualization
arrow_forwardWas this page useful?
Give feedback to help us improve developer.gs.com and serve you better.